Face to face / Online public schedule & onsite training. Restaurant lunch included at STL venues.
From £460 List price £700
This one day course is ideal for those looking to gain a firm understanding of how to produce and publish powerful visual reports by using the Power BI desktop. Confident Power BI users looking to understand data modelling and further visualisation should attend our “Power BI Modelling, Visualisation and Publishing” course.

An intermediate knowledge of MS Excel and Power Bi Desktop installed
Power Bi Desktop basics
What is Power Bi Desktop
Introducing the Power BI Ecosystem
Getting started with Power BI Desktop
Digital Storytelling
Purpose of creating dashboard/reports
Planning Reports & Dashboards
Structure Reports & Dashboards
Simple Data connections
Connect to Excel data (single table)
Connect to a data model created in Power Bi Desktop
Simple Calculations
Sum
Average
Divide
Multiply
Power Bi standard visuals
Chart
Table
Matrix
Treemap
Funnel
Map
KPI
Gauge
Card
Multi Row Card
Slicer
Custom Visuals
Import and use custom visuals
Visuals interactions
How to use Images, Shapes, and Textboxes on pages
Buttons and Bookmarks
Add navigation to report
Add interactivity to reports using buttons
Drill/Filter & Sort
Page level filters
Report level filter
Drill through levels in visuals
Sort data in visuals
Sort by column
Tooltip Page
Control Tooltips
Create Tooltip pages
Set interaction between visuals and tooltip pages
Layout and Formatting
Format visuals
Format pages
Work with themes
Snap Object to Grid
Use gridlines
Lock Objects
Selection Pane
Conditional Colour formatting
Basic Publishing
Arguably, the most experienced and highest motivated trainers.
Training is held in our modern, comfortable, air-conditioned suites.
Modern-spec IT, fully networked with internet access
A hot lunch is provided at local restaurants near our venues:
Courses start at 9:30am.
Please aim to be with us for 9:15am.
Browse the sample menus and view joining information (how to get to our venues).
Available throughout the day:
Regular breaks throughout the day.
Contains unit objectives, exercises and space to write notes
Available online. 100+ pages with step-by-step instructions
Your questions answered on our support forum.
|
|
Harrods
Martha Brown,
Sustainability Manager
Jens was really information and had great energy! I now feel much more confident when tackling this at work
Power BI Reporting
ASMPT
Terry Child,
Senior Manager, Digital Workspace Architect
A nice introduction into Power BI. Built a useful demo. I feel like the written material to back up the presentation could be a lot better, it did not seem to align.
Power BI Reporting
HM Treasury
Rish Watts,
N/A
Fantastic presenter. Jens makes what could be a very dry topic very engaging. He is very fun and a great communicator. Bravo
Power BI Reporting
Our Power BI beginner training courses introduce participants to essential reporting techniques, data visualisation, and dashboard creation. You'll learn how to use Power BI for Beginners, explore practical reporting scenarios, and gain hands-on experience with tools used in corporate environments across London and beyond.
This Power BI introduction training is designed for corporate teams, finance professionals, analysts, managers, administrators, and anyone keen to develop their skills in business intelligence and reporting. Whether you're new to Power BI or looking to refresh your knowledge, the course is suitable for a wide range of job roles.
No prior experience with Power BI is necessary. Our Power BI introduction training courses start from the basics, making them ideal for beginners and those seeking a solid foundation in reporting and analytics.
The Power BI reporting training London programme is delivered over a single day, providing a comprehensive introduction without taking up too much of your team's time. Flexible scheduling options are available to accommodate busy professionals.
Yes, we offer power bi reporting training courses both on-site at your office and at our modern training centres in Central London. This ensures minimal disruption to your business and a convenient learning experience for your team.
Certainly. Our Power BI beginner training courses London are available as live, interactive online sessions, allowing remote teams to benefit from expert instruction wherever they're based.
Absolutely. We specialise in customising Power BI introduction training courses to suit your organisation's specific processes and data requirements, ensuring the learning is directly relevant to your team's day-to-day work.
Course fees for Power BI reporting training London vary depending on group size and delivery format, just reach out for a quote. Our public schedule pricing and availability is updated constantly so just refer to the pricing section on this page.
| Next date | Location | Price |
|---|---|---|
| Tue 3 Mar | Online | £525 |
| Wed 18 Mar | Bloomsbury | £490 |
| Fri 17 Apr | Online | £490 |
| Wed 22 Apr | Bloomsbury | £490 |
| Tue 26 May | Bloomsbury | £489 |
| Fri 5 Jun | Online | £483 |
And 23 more dates...
Loading content...

![]()
![]()
![]()
![]()
![]() Excellent
Excellent
Phoenix Consulting
Senior Quantity Surveyor
John Davies
Brilliant course on PowerBI
"The trainer was very knowledgeable and went above and beyond to ensure we all left with a good understanding of the topic. The notes provided were detailed and will help going forward"
Tutorials and discussions on MS Office
MS Office tips to save you time
MS Office shortcut keys for all versions
Handy info on industry trends
Latest news & offers
Loading content...
Below are some extracts from our Power BI Reporting manual.
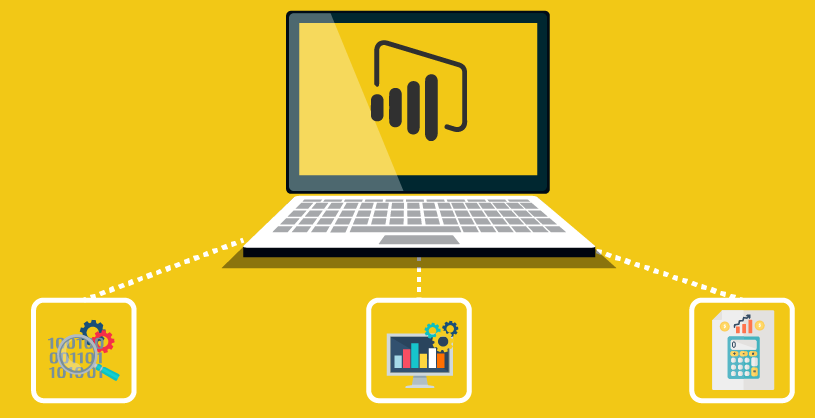 Much like the Power BI cloud service, Power BI Desktop provides businesses with a powerful analytics and data visualisation solution. It helps businesses understand large sets of data from data sources such as Excel spreadsheets and databases.
It can be used to calculate things such as your monthly sales profits and help you make smarter business decisions powered by data that your business collects. The data can be visualised into unique graphics that help you understand the data more easily, and these insights can be embedded in other apps and websites.
It supports hundreds of different data sources to ensure that your business doesn’t need to change its workflow to support Power BI Desktop. The software works in real-time to provide up-to-date analytics and insights for your business.
 Power BI Desktop supports many more data sources
 It supports different themes that can be personalised by the business
 It supports shaping and modelling of data
 It can be customised further using the Python programming language to generate unique visualisations
 It cannot be shared as easily as the cloud-based Power BI service
 Power BI Desktop enables anyone to create advanced graphical representations of analytics with familiar tools that are similar to Microsoft Excel
 It doesn’t require technical knowledge and the interface is intuitive to use, meaning anyone can take advantage of its powerful tools
 It features advanced tools that can give users more control once they’re more familiar with the software
Simple Integration With Existing Software
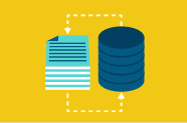 Power BI Desktop can grab data from hundreds of sources such as Excel, SharePoint, Azure SQL DB and Dynamics 365
 Data is updated dynamically, meaning all of the integrations you create are automatically kept up to date
 This provides your business with actionable insights even if you lead a dynamic business that changes its goals frequently
 Power BI Desktop allows you to easily publish your reports so you can provide them to those that need it
 You can create mobile-optimised reports at the push of a button so that the data is easy to understand and read regardless of the device
 You can embed reports created in Power BI Desktop into websites and existing apps to make the data more accessible
Call for assistance
We will call you back