Your Power BI report needs to be as user friendly as possible for an end user to make insightful business decisions efficiently. So, what better way to grab their attention with the most salient sections of your report than to use Bookmark Navigator buttons. These buttons usually appear on the opening page and work by directing the end user to another page that is automatically filtered to the specific metrics that they want to see. A clearly labelled button is much easier to use than the filter tools so is ideal for those who have limited knowledge of Power BI.

What is a Bookmark, and why are they useful
A bookmark in a Power BI report is simply a snapshot of a filtered view captured in the report’s memory. Just like a bookmark on a website, it reflects the current view and can be ‘revisited’ any time you like. A Power BI report may contain many pages with many visuals on each page. It can be somewhat overwhelming to navigate to the data of interest so bookmarks in the form of buttons can help with this analysis and help you be more productive
How to get started
There are 2 stages to creating Bookmark Buttons. First you need to create the bookmark on one page and then attach it to a button on another page. Up until November 2021, this was the only way to create these buttons. Since then the new Navigator Bookmark button feature has made the ‘button attachment stage’ a lot more automated.
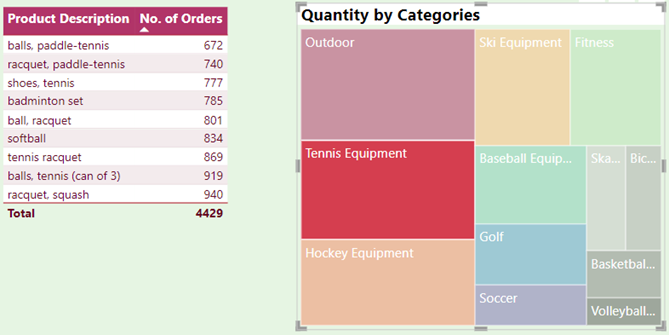
Let’s say you are reporting on the number of orders for each Product. You want to select a particular Product Category so that the report instantly directs you to a filtered list of all products’ orders for this category e.g. Tennis equipment (see below)
- In Power BI Desktop, create a ‘Welcome Page’ (for the Bookmark buttons)
- On a new page create a Table based on Products and the Number of Orders
- Next, create a Treemap visual based on ‘Quantity by Category’
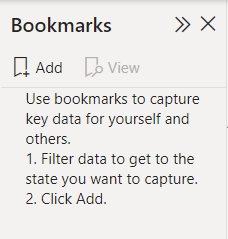
- Go to VIEW > BOOKMARKS to display a Bookmark pane:
- Now select ‘Tennis Equipment’ for example, from the Treemap to show all tennis related products
- Click the ‘Add’ button, go to the 3 dots, and choose RENAME from the list. Type ‘Tennis’ to label the bookmark
- Repeat steps 5 and 6 for two more categories
- Create a 4th Bookmark based on ‘All Categories’ i.e. one which shows no filtering
- Now click on each bookmark to check it reflects the correct filtered state
- On the ‘Welcome page’ go to INSERT > BUTTONS > NAVIGATOR > BOOKMARK NAVIGATOR
This action automatically displays a horizontal set of buttons:

- Holding down the ‘Control’ key, click on one of the buttons and you will be directed to the filtered view of the other page
Once your report is published, there is no need to use the Control key to activate the Bookmark buttons.
Conclusion
Using Bookmark Navigator buttons within your Power BI reports can significantly improve the end user experience. This will inevitably help them to be more efficient and profitable when making those all-important business decisions.
To learn more about Digital Storytelling, click on the link below:
https://www.stl-training.co.uk/sharing/principles-of-data-storytelling/83