If you want to add dynamic text to give your audience more detailed Power BI reports, you can follow STL’s LinkedIn page. This is first part of the series, but more will follow.

In another series of blog posts from STL about AI visuals, you could see how the smart narrative visual could analyse another visual and generate a text box with useful text (see link below).
https://www.stl-training.co.uk/b/power-bi-ai-visuals-part-4-smart-narrative/
The smart narrative tool looks at trends and key influencers, but if you want to be in charge of the text you want to display on a report, you will have to write the DAX to get it.
In the example below a line chart displays sales profit by customer segment and the chart is filtered by a slicer to display customers in U.S.A.
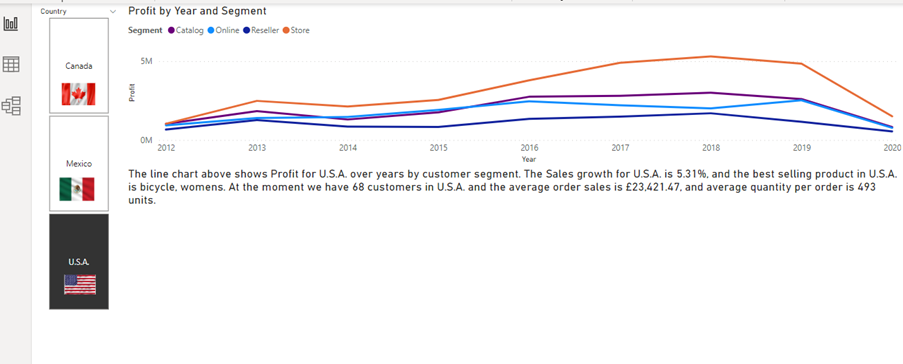
Under the chart a text box is added, and by DAX the text box displays useful information for the report audience.
The text in the text box is dynamic and will change by all filtering on this page.
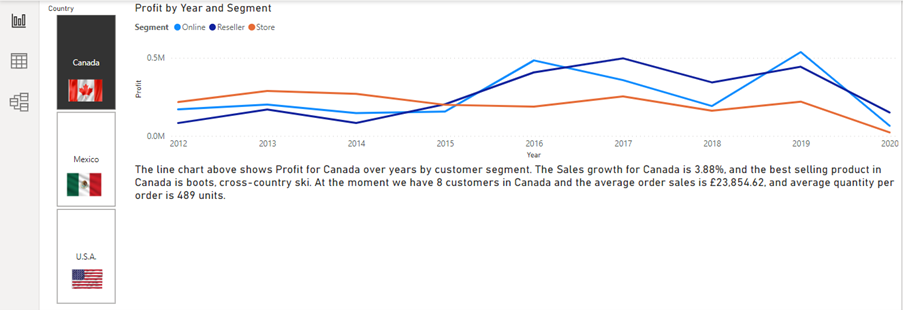
Below, Canada is selected from the slicer. You can see that the dynamic text now has changed to show Canada details.
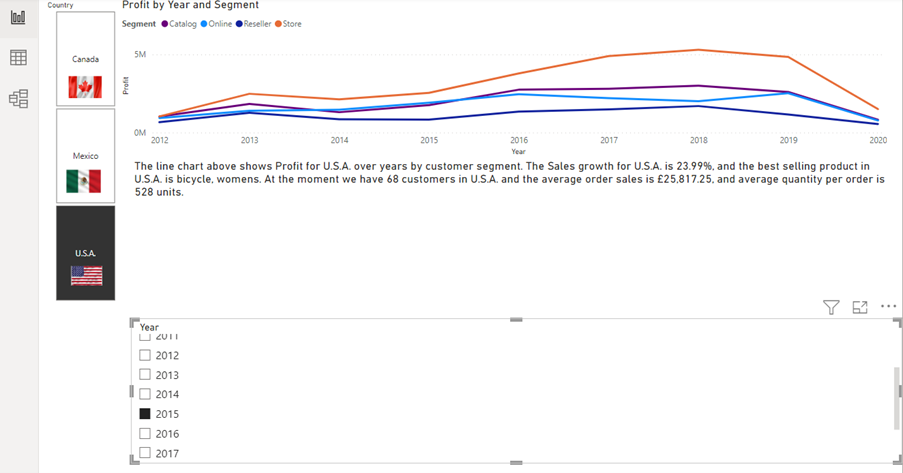
A year slicer has been added to the report (The interaction between the year slicer and the line chart has been deactivated), and the text box’s information have been changed again to only display the selected year.
And now to the DAX part.
It may look a bit advanced.
A measure has been created see following DAX:
Country text =
” The line chart above shows Profit for ” & VALUES ( Customers[Country] ) & ” over years by customer segment. The Sales growth for ”
& VALUES ( Customers[Country] ) & ” is ”
& FORMAT ( [Growth], “0.00” ) & “%, and the bestselling product in ”
& VALUES ( Customers[Country] ) & ” is ”
& CONCATENATEX (
TOPN ( 1, VALUES ( Items[Product Description] ), [Sales] ),
[Product Description],
“;”
) & “. At the moment we have ”
& COUNT ( Customers[Customer Id] ) & ” customers in ”
& VALUES ( Customers[Country] ) & ” and the average order sales is ”
& FORMAT ( DIVIDE ( [Sales], COUNTROWS ( Orders ), 0 ), “currency”, “en-gb” ) & “, and average quantity per order is ”
& FORMAT (
DIVIDE ( SUM ( Line_Items[Quantity] ), COUNTROWS ( orders ), 0 ),
“0,00”
) & ” units.”
In the DAX you will find a combination of other DAX measures, text, and DAX functions all concatenated by & (ampersand). And all free text surrounded by “” (quotation marks).
To make it simpler I will break down the DAX in smaller pieces.
Part 1:
Country text =
” The line chart above shows Profit for ” & VALUES ( Customers[Country] ) & ” over years by customer segment. The Sales growth for ”
& VALUES ( Customers[Country] ) & ” is ”
The VALUES ( Customers[Country] ) return the value selected from the slicer, so if Canada has been selected from the slicer, the first part will return
“The line chart above shows Profit for Canada over years by customer segment. The Sales growth for Canada is”
Part 2:
& FORMAT ( [Growth], “0.00” ) & “%, and the bestselling product in ”
& VALUES ( Customers[Country] ) & ” is ”
In my example model I have used a time intelligence DAX function SAMEPERIODLASTYEAR to be able to calculate the growth.
Last year = CALCULATE([Sales],SAMEPERIODLASTYEAR(Dates[Dates]))
(If you want more insight about time intelligence DAX function, follow the link below:
https://www.stl-training.co.uk/b/power-bi-mysterious-calculate-function-3-time-intelligence/)
Then the Growth measure looks like this:
Growth = divide([Sales]-[Last year],[Last year],0)
To get it formatted you can use the Format function. In this example with two decimals and the % sign.
Part 2 if Canada is selected from the slicer will return:
“3.88%, and the bestselling product in Canada is”
Part 3:
& CONCATENATEX (
TOPN ( 1, VALUES ( Items[Product Description] ), [Sales] ),
[Product Description],
“;”
) & “. At the moment we have ”
The CONCATENATEX function is used to extract the product name. The TOPN function is used to find the top 1 best selling product by the sales.
Part 3 if Canada is selected from the slicer will return:
“cross – country ski. AT the moment we have”
(cross = country ski is number 1 selling product in Canada in the data set used here)
Part 4:
& COUNT ( Customers[Customer Id] ) & ” customers in ”
& VALUES ( Customers[Country] ) & ” and the average order sales is ”
& FORMAT ( DIVIDE ( [Sales], COUNTROWS ( Orders ), 0 ), “currency”, “en-gb” ) & “, and average quantity per order is ”
The number of customers in Canada can be displayed in the text string by count the number of customer IDs.
And to return the average sales per order can be done by dividing the sales by number of orders. In the example data set a table store a record for each order in an Orders table.
The FORMAT function is here used to return currency formatting.
Part 4 if Canada is selected from the slicer will return:
“8 customers in Canada and the average sales order is £23,854.62, and average quantity per order is ”
Part 5:
& FORMAT (
DIVIDE ( SUM ( Line_Items[Quantity] ), COUNTROWS ( orders ), 0 ),
“0,00”
) & ” units.”
Again, the FORMAT function is used, this time to get 0 decimals, and the DIVIDE function to get the average quantity per order.
Part 5 if Canada is selected from the slicer will return:
“489 units.”
The whole text string if Canada is selected from the slicer will return:
“The line chart above shows Profit for Canada over years by customer segment. The Sales growth for Canada is 3.88%, and the bestselling product in Canada is cross – country ski. At the moment we have 8 customers in Canada and the average order sales is £23,854.62, and average quantity per order is 489 units.”
Last step is to add the dynamic text measure to a text box.
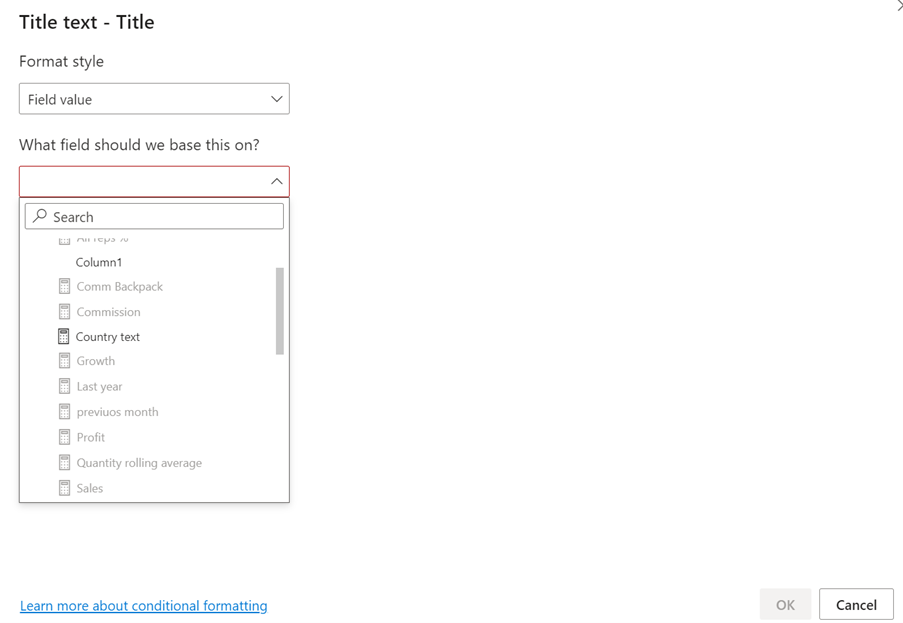
Add a Text box to the page and turn on Title in the Format pane to the right.
Next to the Text input box press the fx button.
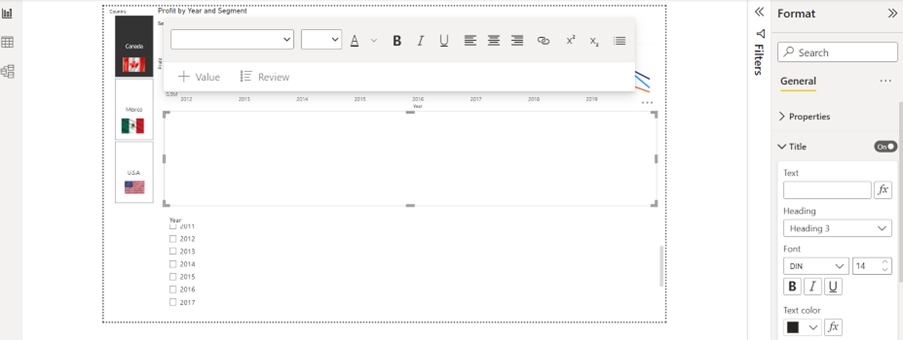
Click the drop-down arrow next to the “What field should we base this on?” navigate, find the measure, select it, and click OK bottom right.
Conclusion
You can add much more information to your reports by creating dynamic text boxes. They allow you to be able to explain the visuals, you can point out specific details, which are important for the audience.
You can find more examples like this by following STL’s LinkedIn page. Dynamic text can be used for much more than just creating text for text boxes.