DAX can be complicated and challenging. If it is not done right, DAX can be particularly difficult to debug and can slow down the underlying queries. In other words, you do not know if you have the right results. This means the audience of your reports could be sitting and waiting for the output when they filter the report.
Often complex calculations require us writing compound or complex expressions. Compound expressions can involve the use of many nested functions, and possibly the reuse of expression logic and reuse measures multiple times. All of this will add to the time required by the underlaying queries to display the result.
Using variables in your DAX formulas can help you write more complex and efficient calculations. Variables can improve performance and consistency and make the measures easier to read and understand.
In this blog post, you will see demonstrations of some of the benefits, you will achieve by using variables.
In the example you will see the benefits in a year over year profit growth % measure. The math is:
Current year sales minus sales cost minus last year sales minus sales cost divided with last year sales minus sales cost.
To get the values last year you will need to use a time intelligence function.
(You can click the link here to get more insight about time intelligence: https://www.stl-training.co.uk/b/power-bi-mysterious-calculate-function-3-time-intelligence/)
The measure without variables will look like below.
Profit Growth yoy % =
DIVIDE (
( [Sales] – [Sales cost] )
– (
CALCULATE ( [Sales], PARALLELPERIOD ( Dates[Date], -12, MONTH ) )
– CALCULATE ( [Sales cost], PARALLELPERIOD ( Dates[Date], -12, MONTH ) )
),
CALCULATE ( [Sales], PARALLELPERIOD ( Dates[Date], -12, MONTH ) )
– CALCULATE ( [Sales cost], PARALLELPERIOD ( Dates[Date], -12, MONTH ) ),
0
)
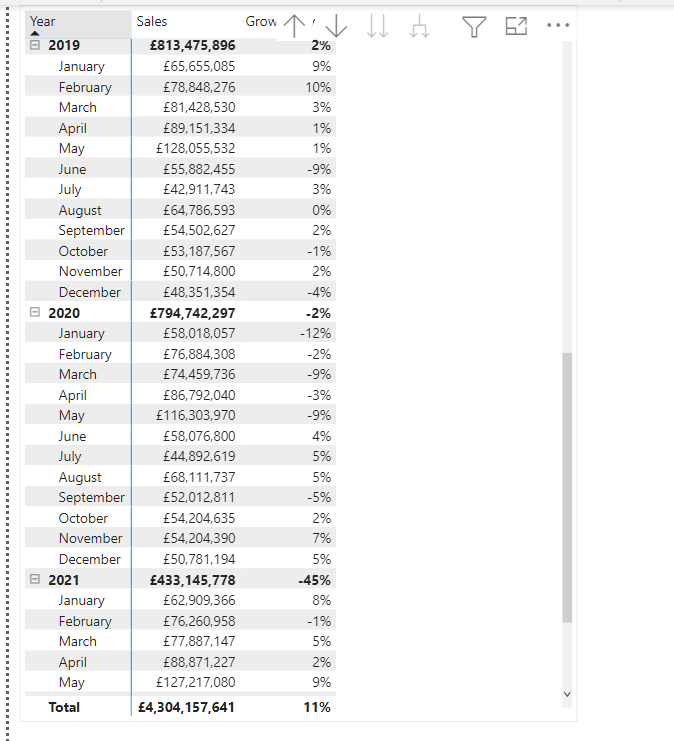
And could be visualised on a report page like this in a matrix visual:

Improve performance with DAX
Notice in the DAX above that there are many repetitions. The CALCULATE function is used four times, the PARALLELPRIOD function four times, and the sales and sales cost measure been referenced several times.
This will not only make it complex to read, but will also slow down the query, by asking the query to do the same calculations several times. The measure definition can be made more efficient by using variables.
How to create a variable
You create a variable by typing VAR and then you need to name the variable. After the name of the variable, you need to tell, what you want to store in the variable. To get the result you want to visualise you use the word return.
Below you can see the first variable called profit. This variable will now calculate the profit and store the profit.
Profit Growth yoy % =
VAR profit = [Sales] – [Sales cost]
VAR LastYear =
CALCULATE ( [Sales] – [Sales cost], PARALLELPERIOD ( Dates[Date], -12, MONTH ) )
VAR DiffCurLast = profit – LastYear
VAR Result =
DIVIDE ( DiffCurLast, LastYear, 0 )
RETURN
Result
We have used 4 variables to get the result. 3 variables for the 3 calculations to get to the Result, which here is stored in a variable named Result. The word RETURN is used to explain the measure what to return from the measure. Above the value in the Result variable needed to be visualised.
The measure continues to produce the correct result and does so in about half the query time.
Improve readability
In the previous measure definition, notice how the choice of variable name makes the RETURN expression simpler to understand. The expression is short and self-describing.
Simplify debugging
Variables can also help you debug a formula. To test an expression assigned to a variable, you temporarily rewrite the RETURN expression to output the variable.
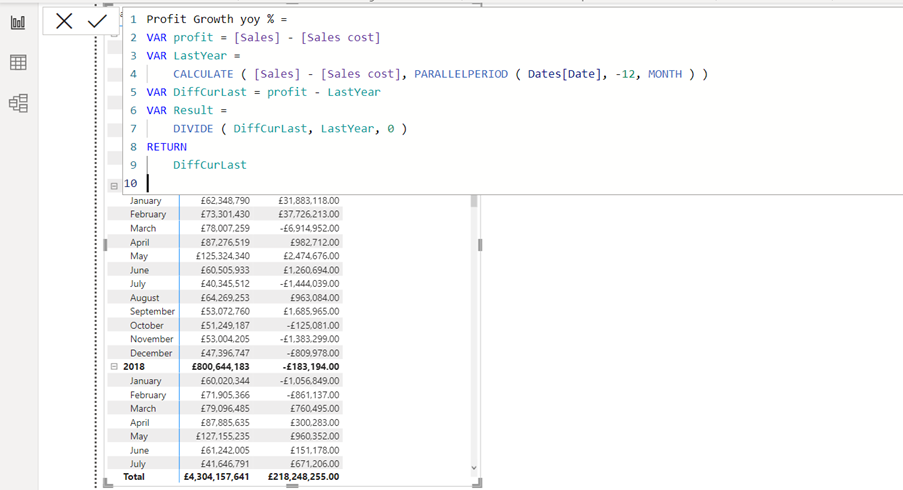
By changing the DAX RETURN to DiffCurLast
Profit Growth yoy % =
VAR profit = [Sales] – [Sales cost]
VAR LastYear =
CALCULATE ( [Sales] – [Sales cost], PARALLELPERIOD ( Dates[Date], -12, MONTH ) )
VAR DiffCurLast = profit – LastYear
VAR Result =
DIVIDE ( DiffCurLast, LastYear, 0 )
RETURN
DiffCurLast
The matrix will now display the difference value not the in percentage.
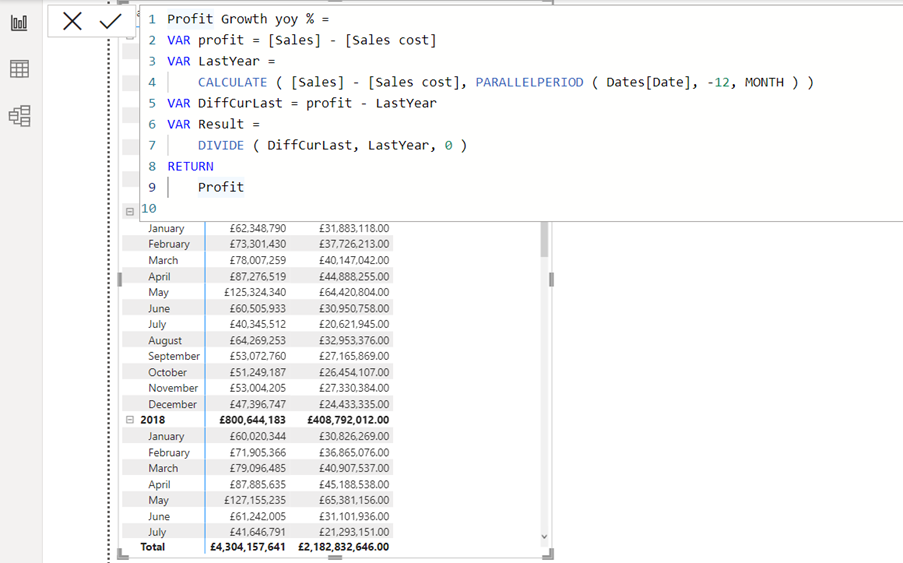
And by changing the RETURN to profit you debug the profit = [Sales] – [Sales cost]
Profit Growth yoy % =
VAR profit = [Sales] – [Sales cost]
VAR LastYear =
CALCULATE ( [Sales] – [Sales cost], PARALLELPERIOD ( Dates[Date], -12, MONTH ) )
VAR DiffCurLast = profit – LastYear
VAR Result =
DIVIDE ( DiffCurLast, LastYear, 0 )
RETURN
Profit
You can debug all the variables to make sure that each part of the measure returns the right result
Conclusion
Variables in DAX measure can reduce the execution time for the underlaying queries. Make DAX measures easier to read and understand, and much easier to debug.
You can learn about variables on STL’s one day DAX course, if you want to get insight about variables in DAX measures.


