DAX (Data Analysis eXpressions) is the function language in Power BI desktop. When DAX is used to create measures, it can hard to understand the logic at times. Especially one function, the Calculate function, can be challenging.
We visit the mysterious Calculate Function for the third time, in this four part series of blogs.
The Calculate function reacts differently to row, column, filter, and table context than the other DAX functions and the Calculate function is important for nesting other functions.
In this blog post you will see some examples of how the calculate function works with time-intelligence.
Time Intelligence
The time-intelligence functions that enable you to control data using time periods, including days, months, quarters, and years, and then build and compare calculations over those periods.
Most time-intelligence functions need to be nested inside the Calculate function.
In this example, sales need to be compared up against previous year.
The structure of the Calculate function:
CALCULATE(<expression>[, <filter1> [, <filter2> [, …]]])
In all the examples the expression will be total sales and in the filter arguments, the time-intelligence functions will be nested.
First, the SamePeriodLastYear function.
All time-intelligence functions need to know the primary key in the Dates table (Calendar Table).
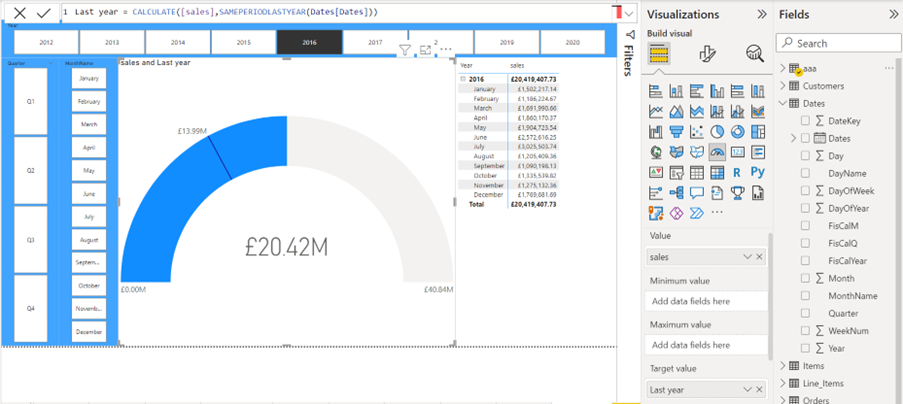
Last year = CALCULATE([sales],SAMEPERIODLASTYEAR(Dates[Dates]))
Below in the example a Gauge visual is used. The Sales are added to Value and above measure to Target. The page is filtered to show 2016 by a slicer.
The blue part of the Gauge chart (£20.42m) is the sales for 2016, and the line in the Gauge chart (£13.99m) is last year. In this example 2015.
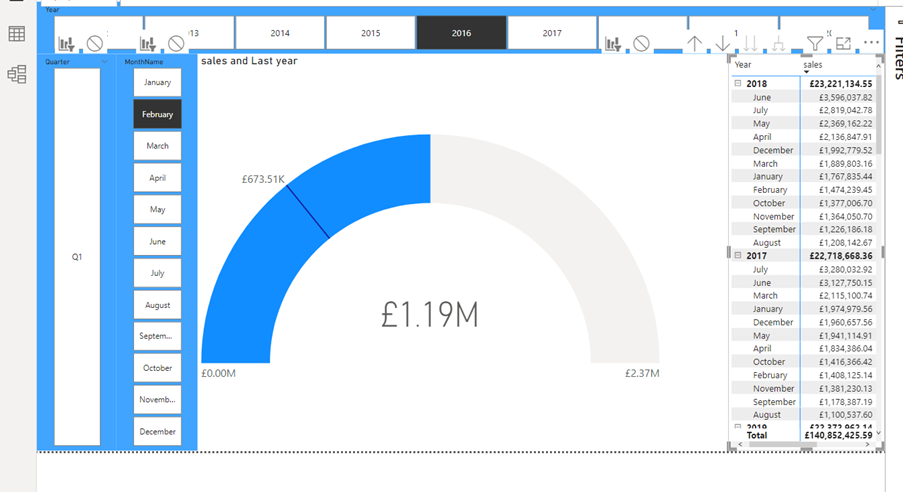
Below the page is filtered by two slicers to February 2016. The blue part of the Gauge chart (£20.42) is the sales for February 2016, and the line in the Gauge chart (£13.99) is February 2015. The combination of the Calculate and SamePeriodLastYear function will always go back to the same period last year. In this case, to February 2015.
In the next example of the combination of the Calculate and SamePeriodLastYear function. The sales growth needs to be visualised.
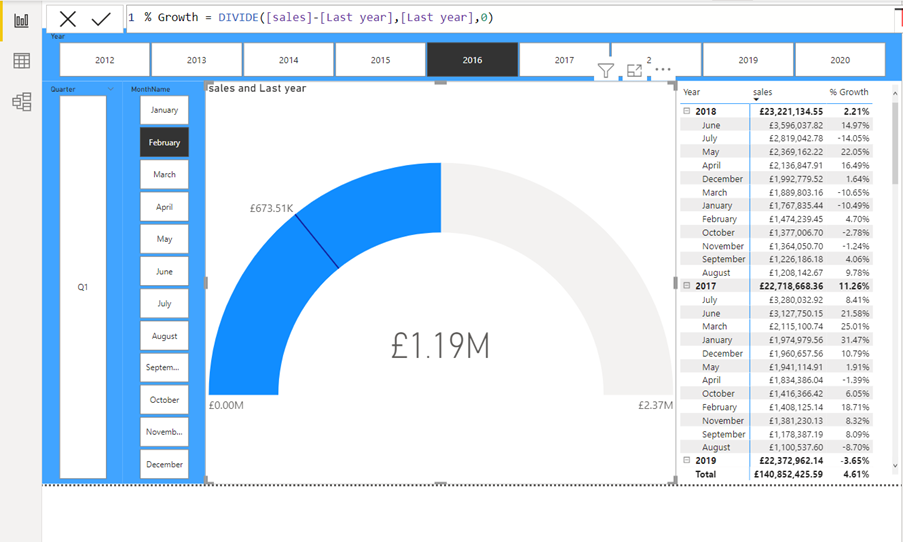
The DAX measure used for this: % Growth = DIVIDE([sales]-[Last year],[Last year],0)
The sales minus last year’s sales divided with last year’s sales.
The Last year sales measure from the previous example above, has just been reused here. In the Matrix below right, the Matrix display the percentage difference from previous year and same month previous year.
Conclusion
I call the Calculate function the mother of DAX functions. It is the most important DAX function (my opinion), but to get the most out of it you will need to understand, how the function reacts to row, column, filter, and table context, and how the Calculate function takes care of other functions
This is part 3 of a series of blog posts as mentioned at the top about the mysterious Calculate function.
In the next blog post in this series, you will see how the mysterious Calculate function is different from other DAX functions when it comes to filter context.


