DAX in Power BI Desktop is an amazing tool that allows you to fully analyse your data giving you real insights to achieve profitable outcomes.

You can get a lot of Business Intelligence from your reports without any DAX whatsoever. However, you may want specific information that is only possible to obtain with DAX. For example, % Sales Growth Year on Year by Region or a Rolling Last 12 month total. In this article you will find out what DAX means, what it can be used for and how it can help you to gain a competitive advantage in your data analysis.
What is DAX and why is it so useful?
DAX stands for Data Analysis Expressions. It is a formula language used to optimise the performance of data analysis in Power BI Desktop. One of its main benefits is being able to re-use it numerous times. This means faster processing time since a calculation used in another calculation will not need to be reprocessed because the first calculation is already stored in memory. Consequently, end users can make instant business decisions more efficiently as they receive their updated reports. Moreover, the greater flexibility in using DAX means that end users will have a competitive edge over those who only use standard analysis tools.
How to get started
The world of DAX is vast and can get complicated especially if the data is spread across many tables. To keep things simple, we will look at a practical example drawing data from a single dataset. Let’s say you had some global sales data and you needed to show the Average number of Orders per Country. To achieve this, we will look at creating 3 DAX measures:
-
-
- Total number of Orders (measure 1)
- Number of Countries (measure 2)
- Average Orders per Country (measure 3)
-
The first two DAX measures will be created separately and then combined to make the third measure thus speeding up data processing time.
-
-
- Import a single Excel file e.g. ‘Global Food Sales’ into Power BI Desktop
- On the ribbon go to HOME > NEW MEASURE
- Type the following:
-
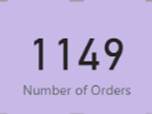
Number of Orders = COUNT(FoodSales[Order ID])
This calculates a total count of all orders where ‘FoodSales’ is the name of the table and OrderID is the field name (note the requirement for square brackets as it is a field)
-
-
- Create a ‘Card’ visual to show the total number of orders:
-
-
-
- Create another new measure and type:
-
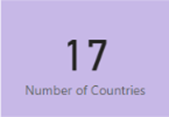
Number of Countries = DISTINCTCOUNT(FoodSales[Country])
This calculates a unique number of countries out of a list of multiple entries for each country
-
-
- Create another Card visual to show the number of countries:
-
7. Create a third measure and type:
Average Orders per Country =
DIVIDE([Number of Orders],[Number of Countries])
- where the [Number of Orders] is the ‘Numerator’
and [Number of Countries] is the ‘Denominator’
-
-
- Format this measure to no decimal places
- Again add this measure to a Card:
-
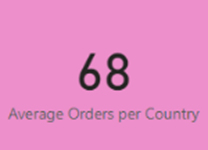
If you add any new Countries to future sales data, this average will automatically update.
Conclusion
Gaining a competitive edge in the marketplace is key to being more profitable. The ability to fully exploit DAX in Power BI Desktop will definitely help you to achieve this goal.

For more articles on Data Analysis and practical uses, please click below:
https://www.stl-training.co.uk/b/easily-track-performance-with-analytical-lines-in-power-bi/
https://www.forbes.com/search/?q=data%20analytics&sh=288804da279f