Wendy has attended:
Excel Introduction course
Showing % variance for data in excel or pivot table
Hi
I can't find in the forum anything on creating a variance percentage in an excel report or pivot table. If I have some data in a pivot table stating for example Client A in 2010 earns £100 and in 2011 the same client earns £150, how do I create a formula in the next column to show this as a % inrease on the year before? Likewise, I need the formula to work in reverse... if Client A earns £150 in 2010 and £100 in 2011, will the formula show the % down on the prior period as a negative? I need the information illustrated in this way.
Any help is much appreciated.
Thanks
Wendy
RE: Showing % variance for data in excel or pivot table
Hi Wendy
Thanks for getting in touch. You can use the following formula to calculate the percentage variance between two values:
=(Later value - Older value) / Older value
I've attached a workbook with the formula in to demonstrate.
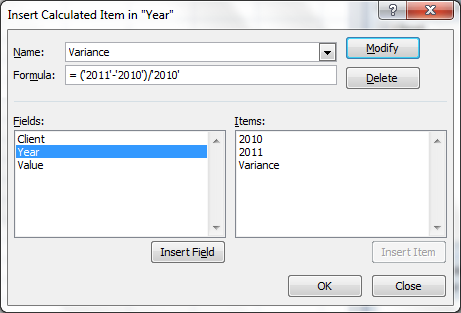
You can also do it with a PivotTable, but you need a Calculated Item. Build your PivotTable with Clients on the left, Years on the top and Values in the middle, and then click on one of the Year headings. Under the PivotTable Options ribbon click Formulas > Calculated Item.
Enter the Name of your Item (e.g. Variance) and then in the formula build the formula as per my example above (enter a bracket, double click 2011, enter a minus sign, double click 2010, a closing bracket, then a divide sign, then double click 2010. Click Add and OK to add it to the table. As before, this in the example.
Kind regards
Gary Fenn
Microsoft Office Specialist Trainer
Tel: 0207 987 3777
Best STL - https://www.stl-training.co.uk
98%+ recommend us
London's leader with UK wide delivery in Microsoft Office training and management training to global brands, FTSE 100, SME's and the public sector
Attached files...
RE: Showing % variance for data in excel or pivot table
Hi Gary
I can't find the Formulas > Calculated Item on the PivotTable Options ribbon. I can find the formulas Ribbon but can't spot anything called "Calulated Item".
I've tried typing this formula format below along side my pivot table but it is not working. I've tried with and without the ' and ' and still no results.
= ('2011'-'2010')/'2010'
Could you please clarify further.
Thanks
Wendy
RE: Showing % variance for data in excel or pivot table
Hi Wendy
Thanks for your reply. This formula will only work inside the Calculated Item section.
Can you confirm the version of Excel you use? This area has moved around a lot in recent versions.
Kind regards
Gary Fenn
Microsoft Office Specialist Trainer
Tel: 0207 987 3777
Best STL - https://www.stl-training.co.uk
98%+ recommend us
London's leader with UK wide delivery in Microsoft Office training and management training to global brands, FTSE 100, SME's and the public sector
RE: Showing % variance for data in excel or pivot table
Hi Gary
I'm still using 2007. I've managed to get the results now but if you could still infomr me about the calculated item section this would be helpful for future reference as I use spreadsheets every single day in my work.
Thanks
Wendy
RE: Showing % variance for data in excel or pivot table
Hi Wendy
I'm glad it's working for you. I've attached some images in the meantime to show you where these items are located.
Kind regards
Gary Fenn
Microsoft Office Specialist Trainer
Tel: 0207 987 3777
Best STL - https://www.stl-training.co.uk
98%+ recommend us
London's leader with UK wide delivery in Microsoft Office training and management training to global brands, FTSE 100, SME's and the public sector
 GF-calc-field.png
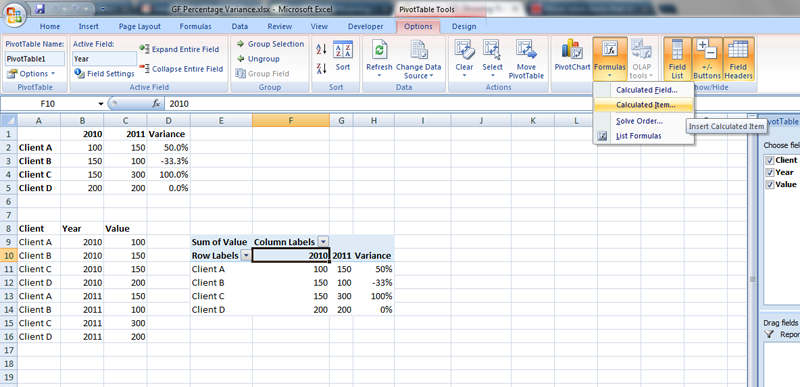 gf-pt-calc.png


