Any project at work can bring about exciting challenges and changes. Read on to learn more about how to identify them, and what the phases of projects look like to help you to run them efficiently and accurately. Rest assured all the content covered here has been tried and tested on our very own project management training courses.
When is a Project a Project?
Too often great projects we are hoping to work on turn out differently to what we expected. Lots of managers wrap a large task up and call it a project. This is because they think that ‘I have a project for you’ sounds more interesting and motivating than ‘I need you to do that big task again.’
So what is the difference between a project and business as usual?
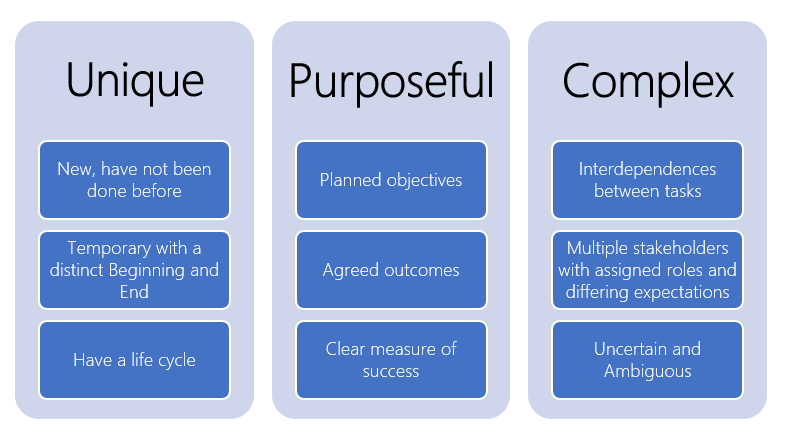
Projects are;
If you are looking at a task which you, or anyone else, have completed in the past, even if only once every few years, it is not a Project. This is Business as Usual. However we can still apply project management principals to large business as usual tasks.
Because they are brand new, have planned objectives and are uncertain and ambiguous, ALL projects bring about CHANGE.
Waterfall and Agile Projects
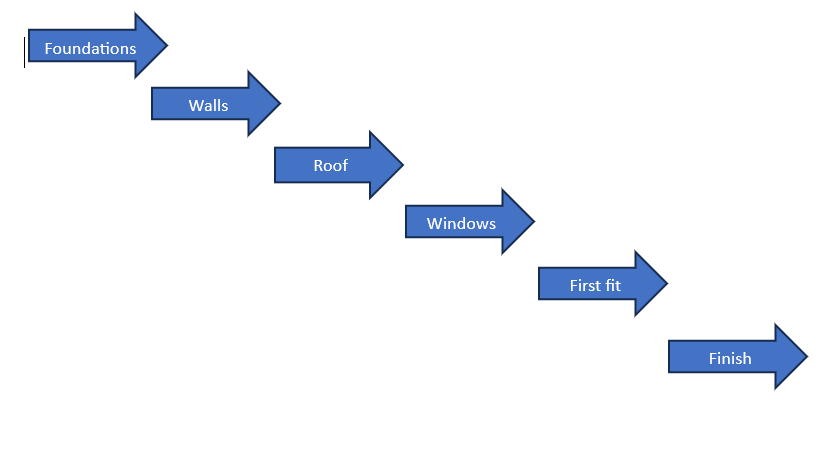
The Waterfall Project Management method has a traditional linear approach where phases cannot advance until the previous phase is complete. Once a phase is complete, it is difficult and costly to revisit it. Therefore the Waterfall method requires that work cannot begin until we have all of the information required, and that we cannot make changes once work has started.
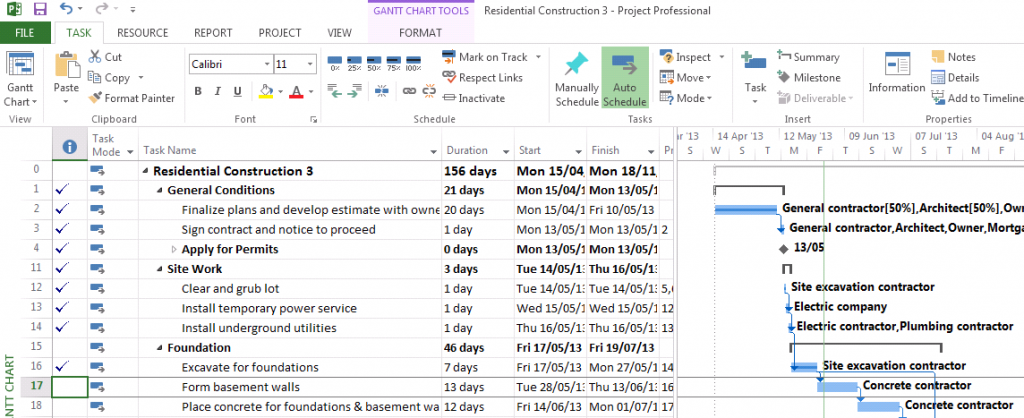
This method works particularly well in construction.
While this approach is effective for straightforward projects that follow a set path, it may not be suitable for more complex projects that demand a more flexible and dynamic approach.
The Agile Project Management method was adopted first by software teams, who moved from the traditional, sequential waterfall approach to a method that allowed consistent feedback and adjustment throughout the development lifecycle. It is a flexible and iterative approach which focuses on continuous releases or sprints, with the ability to adjust each sprint according to changing requirements.
The PM needs to decide which method will work best for their project.
The Project Lifecycle
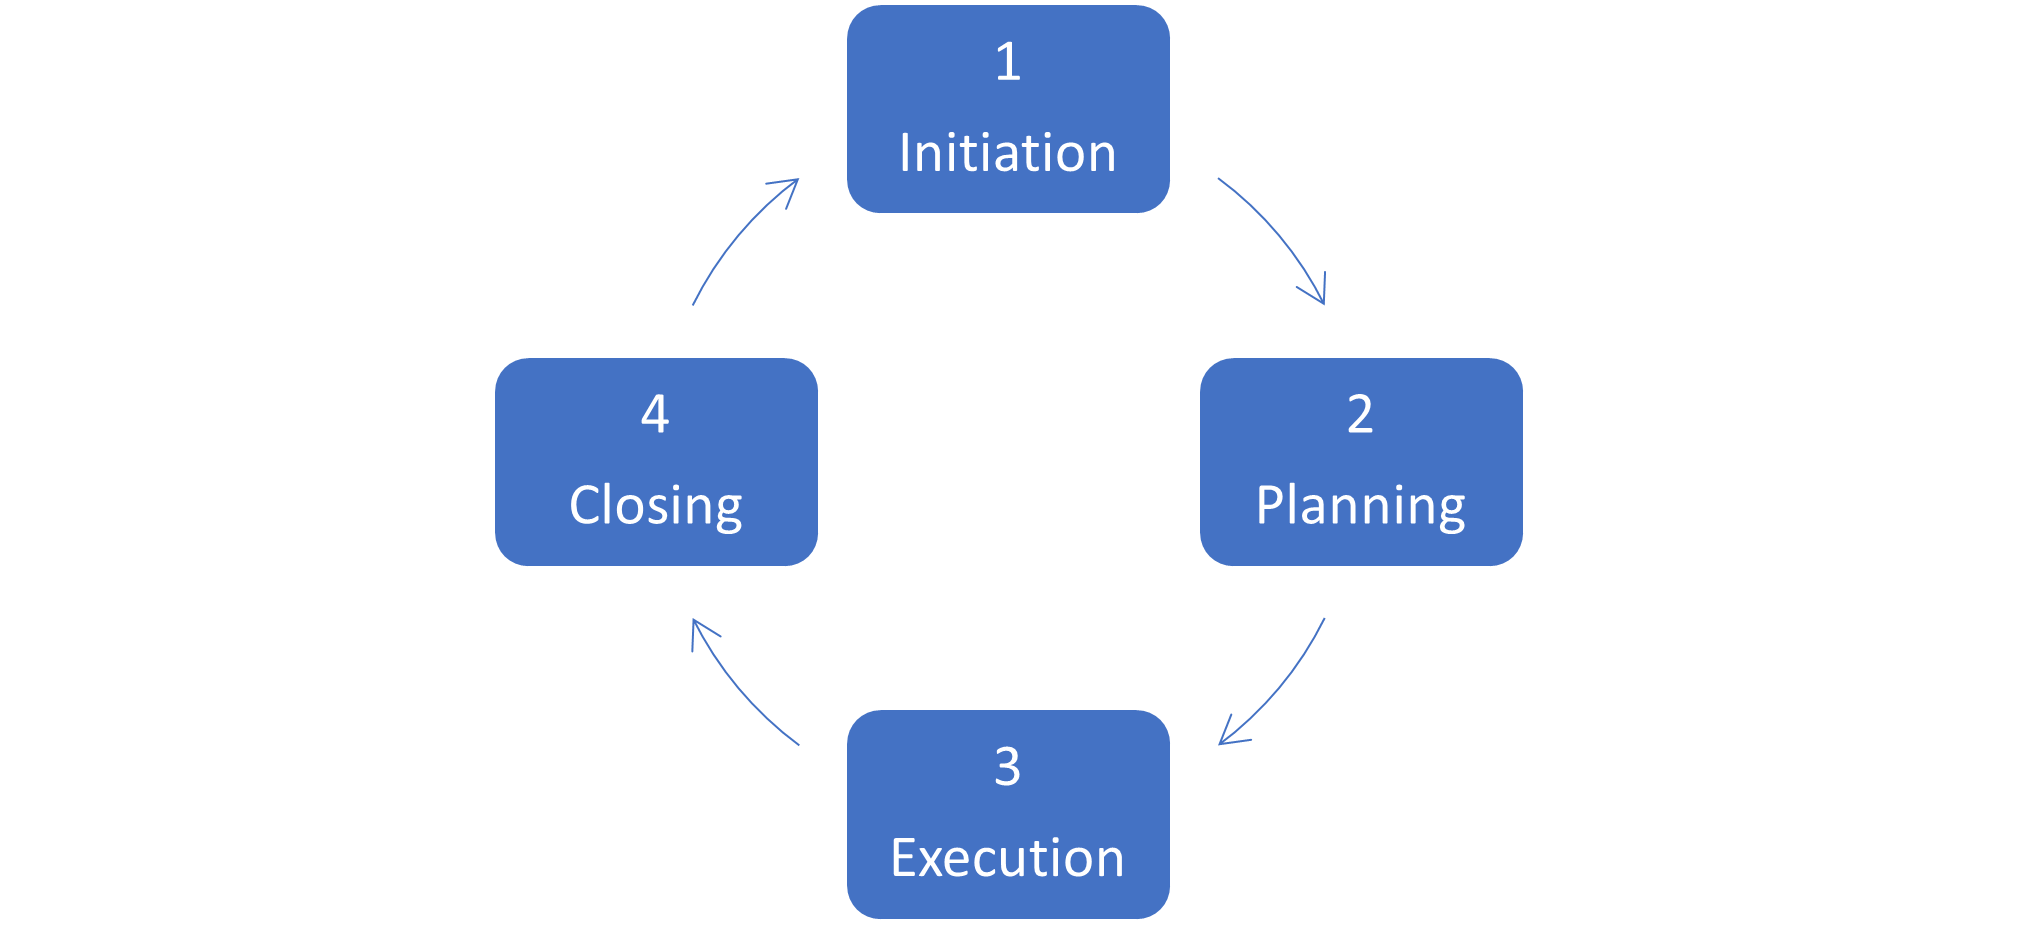
All projects have a lifecycle, and all 4 phases of the Project Lifecycle are equally important.
Project Phase 1 – Initiation
This phase can commence once we’ve tabled an idea. At this stage, the idea is just an idea, as there are considerations to think through before management or investors approve it. These considerations include;
- Is it a nice to do or a need to do?
- The benefits if we do it and the impact if we don’t
- Does this align with our organisational goals?
- When do we need to do it?
- Ball Park figures for costs, timings, and resources
- Do we have the skills and time to do it, or should we outsource it?
- Who is going to authorise it?
- Who is going to manage it?
- Who else will be involved?
- What is included in the project, and what isn’t?
- Potential risks
A business case or Project Initiation Document (PID) including all of these considerations needs to be prepared to support the project.
At the end of the Initiation stage we will have agreed the Deliverables. Deliverables are what we will provide at the end of the project. For example, a system that is going to provide specific data.
There is always the temptation to jump right in and get going on a new project. However, if the initiation stage isn’t thoroughly complete, the project is highly likely to fail or be cancelled, wasting both time and money.
Project Phase 2 – Planning
Now that we have the go ahead, it is time to do some serious planning.
We have to decide how to create the agreed deliverables and exactly what work is involved. This is called Scope. When somebody requests a task or deliverable which had not been agreed at the outset, we describe it as Out of Scope.
To understand exactly what work is involved we create a Work Breakdown Structure (WBS). Every step is broken down into individual tasks with the expected amount of time each task should take. The Project Manager needs to involve people with specific skills and knowledge at this stage to ensure that nothing is missed, and time estimates are as accurate as possible.
The WBS is used to create the project schedule and milestones as well as calculating critical path and costs.
The final things to decide at the planning stage, are what reporting is required, and how risks and communication will be managed.
Project Phase 3 – Execution
It is now time to put our detailed plan into action and ensure we keep the team on track.
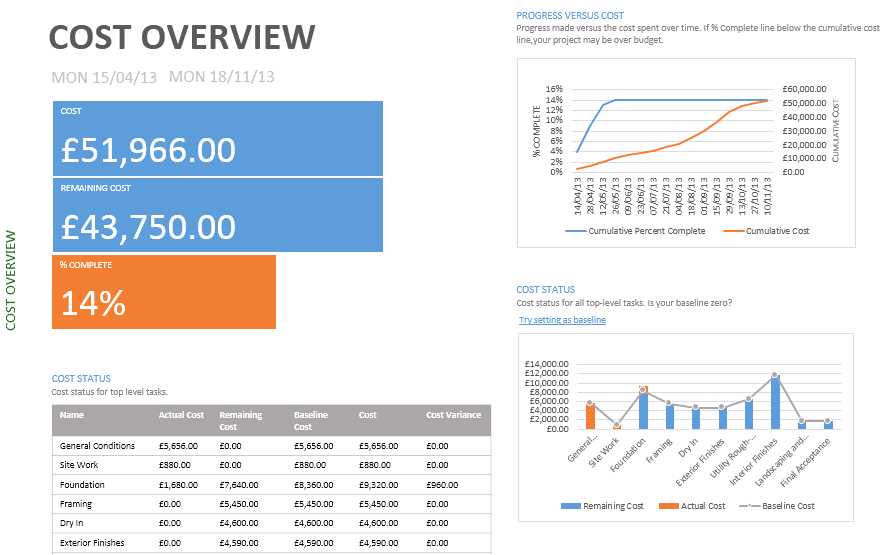
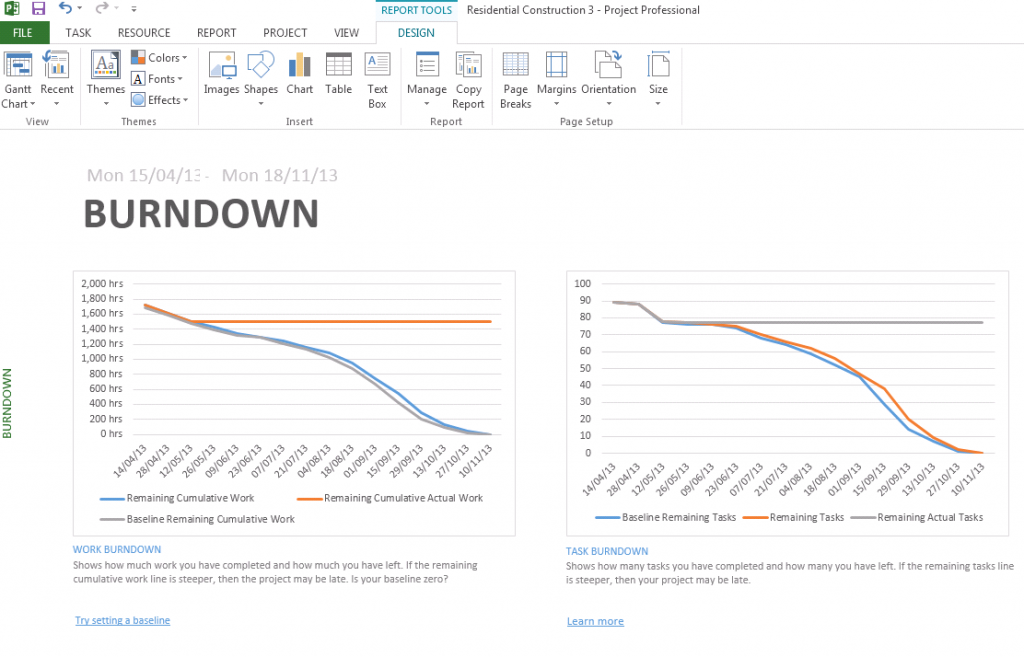
Putting the plan into action involves tracking and measuring progress, managing quality, mitigating risk, managing the budget, and using data to inform decisions.
Keeping the team on track involves setting and monitoring KPIs, supporting, enabling, and motivating the team, and resolving any issues that may arise.
Tasks for the Project Manager during the execution phase include;
- Project Introduction and Kick Off meeting
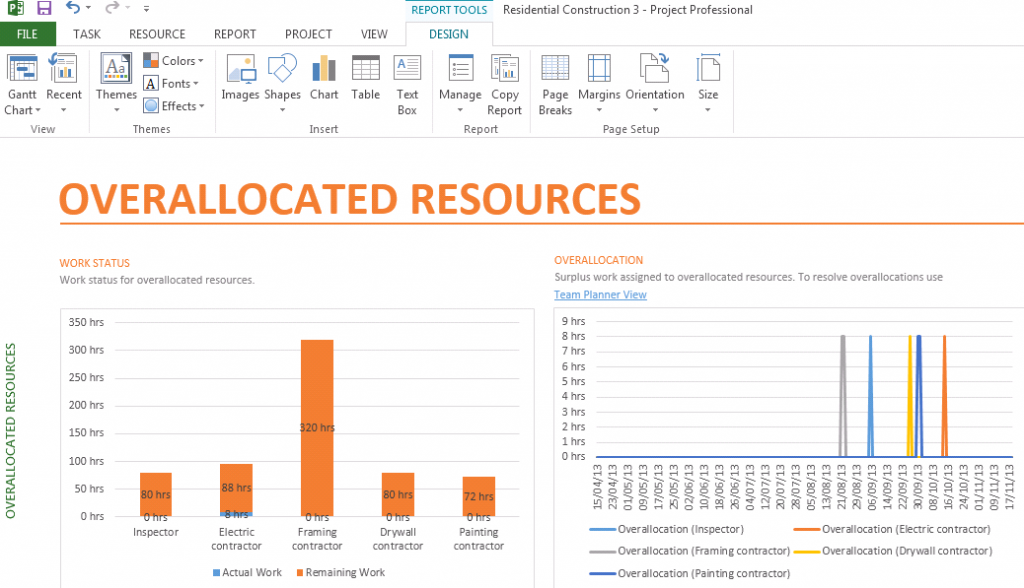
- Assigning resources
- Setting SMART goals and KPIs
- Monitoring progress
- Monitoring time, budget, quality, and scope of work
- Directing, managing, and developing the team
- Problem solving and decision making
- Setting up tracking systems
- Holding status meetings
- Updating the project schedule
- Reporting
- Risk Management
- Change Management
- Modifying plans as needed
- Communicating with all stakeholders
And Phase 4 – Closing
How do we know when we can complete? The project is declared finished when the agreed scope of work is complete, and the agreed deliverables have been signed off and handed over to the new owners.
During the execution phase it is common for out-of-scope requests to creep in. These need to be negotiated at the time as any changes have an impact on time, cost, and quality. We can usually absorb minor changes, but more significant changes may require a completely new project, generally known as Phase 2.
For example, in the case of our system to provide specific data. Phase 1 has been achieved, but now you are being asked to adapt the system to provide additional data. We can’t just bolt this onto the end, or we will never complete. We roll the first system out. Meanwhile a new project, Phase 2, starts to create the adaptations.
Even in Agile projects with all the various iterations or sprints, there has to be a time where we can reach an agreement that the work is complete, and the deliverables can be handed over.
The team will hold a meeting to evaluate successes and failures and present their findings in a final report. The final budget also needs to be counted. We need to store the documentation in a single place.
The Documentation is important for 2 reasons;
- If the project repeats as Business as Usual for example, organising a trade fair, the documentation can be used as an instruction manual.
- If the project is cancelled for any reason, the documentation will need to be provided to auditors to prove where the money was spent.
Finally it is time to celebrate with your team – well done!

