Skip to the content
STL - Blog
Best in-class training – Be delighted, not just satisfied
  • STL Home
  • Blog home
  • Professional & Management
    • Leadership Development
    • Management Training
    • Professional Development
    • Project Management
    • Sales & Customer Service
    • Soft Skills
  • Application
    • Artificial Intelligence
    • Hints & Tips
    • Microsoft Office
      • Access
      • Copilot
      • Excel
      • Excel Data Visualisation
      • MS Project
      • Office 365
      • Outlook
      • PowerPoint
      • VBA
      • Visio
      • Word
    • Microsoft Office Resources
    • Power BI
  • Misc
    • Infographic
    • Technology
    • Fun
    • Company News
  • About us
  • Contact us

excel Resources

  • Create Stunning Charts in Excel and Impress Your Clients

    Create Stunning Charts in Excel and Impress Your Clients

    Fri 17 May 2024

    Data can be a powerful tool for driving business decisions, but a ‘sea of totally unrelated data’, when presented, can confuse your audience. However,  you can make a huge impact by  presenting that data clearly, using captivating visuals that tell a compelling story. This guide will equip you with the skills to leverage the data […]

  • Unleash the Power of Your Data: A Look at Excel Power Pivot

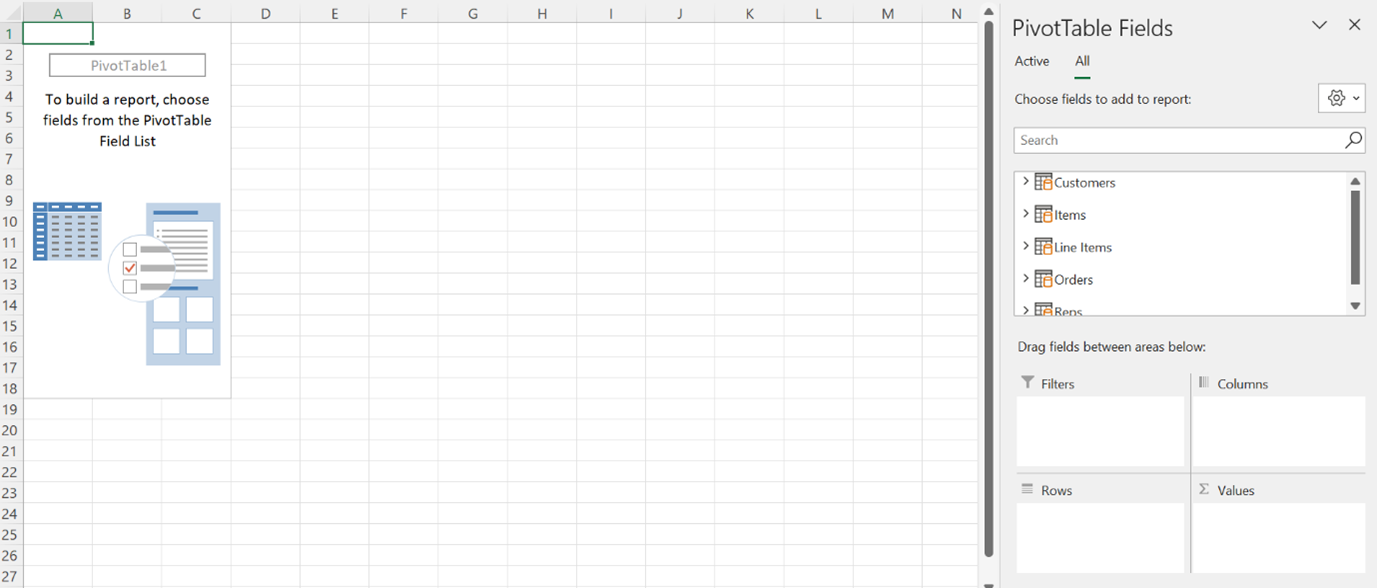
    Unleash the Power of Your Data: A Look at Excel Power Pivot

    Fri 10 May 2024

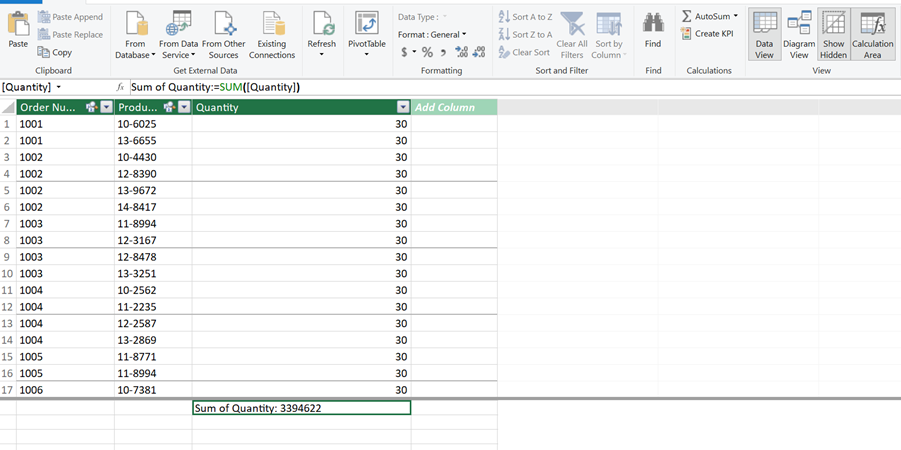
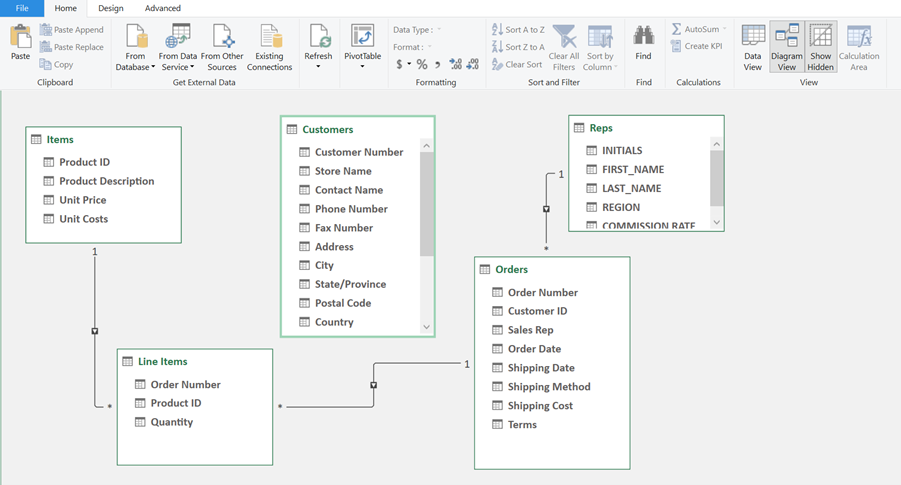
    Ever feel limited by traditional Excel PivotTables? Microsoft Power Pivot offers a revolutionary solution, empowering you to analyse vast amounts of data from diverse sources, all within the familiar Excel environment. Break Free from Limitations Say goodbye to the constraints of single-table analysis! Power Pivot empowers you to: Consolidate Data: Effortlessly integrate information from various sources, […]

  • Excel Data Visualisation: A Powerful Decision Making Tool

    Mon 15 Jan 2024

    Data visualisation is a powerful tool that allows you to view data more clearly. This is vitally important for businesses to help them with crucial decision making. What is data visualisation? Data visualisation is the process of turning raw data into graphical representations. It works by taking selected data in Excel and then choosing from […]

  • How to Use Sparklines in Excel to Visualise Data Trends

    Wed 10 Jan 2024

    Sparklines are a powerful tool in Excel that allow you to visualise data trends in a condensed chart format. Unlike normal Excel charts, Sparklines are embedded in a single cell, making them ideal for displaying trends in sales figures, website hits, and other data over a period of time. In this blog post, we’ll show […]

  • Excel – Linear Estimations for Better Decision Making

    Thu 21 Dec 2023

    Excel is a brilliant tool for data analysis. A useful function or two can help, as several factors can impact your data. Weather, conflicts around the world, inflation, the interest rate, currency rates, subcontractors, number of customers, competitors, special offers, market size etc.   Trend Function and Regression Tool In this blog post, we’ll be […]

  • What-if analysis in Excel

    Wed 13 Dec 2023

    Excel has some powerful tools that you can use to carry out a What-if analysis. We sat down with one of our Excel Experts, Jens, to ask him about three particular data analysis tools and to see whether he would demonstrate how to use them for us. Good morning Jens, you talk a lot about […]

  • Tracking Performance using Conditional Formatting in Excel

    Thu 2 Mar 2023

    Conditional Formatting is one of the most powerful tools in Excel. It can do so much to help you track data with relatively little time and effort. This ‘Quick Win’ tool can be mastered in a few simple steps. The blog will look at what Conditional Formatting is, how to apply it to data and […]

  • Excel – The XLOOKUP function

    Mon 13 Feb 2023

    We can use LOOKUPSs in Excel to search for a value in a column or row, and return a value from a matching column or row. We look at them in a lot of depth on both our Excel Advanced and Excel Advanced Formulas and Functions courses. There are a number of lookup and reference functions […]

  • Create amazing Reports with Microsoft Project

    Mon 14 Jun 2021

    When managing a project using Microsoft Project, stakeholders often need to receive progress updates. Because not everyone can read a Gantt chart, MS Project comes with a set of pre-designed reports and dashboards to help you better understand your data. You can easily create amazing reports with Microsoft Project. Below is an explanation of the […]

  • Four benefits of Moving to Office 365

    Thu 12 Mar 2015

    By J. Peter Bruzzese The recent global recession is still quite fresh in everyone’s minds. From an IT perspective it forced IT administrators to tighten their belts and hold off on upgrades of both hardware and software for quite some time. The growth of “cloud” solutions (like Office 365) has provided IT teams with another option when considering new […]

  • Why Your Business Must Switch From Windows XP

    Wed 24 Jul 2013

    Released on August 24th, 2001, Windows XP is widely regarded as Microsoft’s most successful OS, boasting over 400 million active users at its peak in January 2006. Now almost 12 years old, Microsoft have decided to cease support for Windows XP effective April 8th, 2014. Continued use of the OS after this date runs the […]

  • Pull Data, Not Teeth – The PivotTable Edition

    Wed 17 Jul 2013

    In life as in business, we always strive to find the easiest ways of getting things done. Sometimes, however, the simplest methods involve cutting corners, obtaining short-term results but long-term headaches. One of a long line of Excel features, the PivotTable is the best way to break your information down into more manageable chunks. In […]

  • Project 2013: Burndown charts help track work

    Fri 3 May 2013

    Project 2013 comes with a brand new set of pre-designed reports and dashboards to help you better understand your data. You can visualise performance and analyse resources in ways that weren’t previously possible in Microsoft Project. The burndown report is a much-requested feature that will be especially interesting to those of you practicing agile and […]

  • Excel Training 2013: Sparklines through Quick Analysis

    Thu 2 May 2013

    Introduced in Excel 2010, Sparklines create charts within a cell. It can help to show one figure in context with others and illustrate trends. In this example a blank column is created for the sparklines before selecting the adjacent data. In Excel 2013 the Quick Analysis feature has now brought Sparklines to the fore. Perfect […]

  • Excel : Audit your Spreadsheet with the Inquire Add-In

    Thu 25 Apr 2013

    For users with the Office Professional Plus package, the Inquire add-in comes pre-installed on Excel 2013. Helping you to analyse, audit and review workbooks, this great new feature also has the potential to highlight errors and security concerns. We recently discussed, how to take back control of your spreadsheets by reducing “fat finger mistakes” and […]

  • Excel 2013: Complete data entry quickly with Flash Fill

    Fri 19 Apr 2013

    Save time and effort with Flash Fill for Excel 2013. Just one in a long line of nifty improvements to help you work more efficiently. Flash Fill for Excel 2013 notices patterns in your data entry and then auto completes the remaining, so there’s no need to use formulas or macros to do this. Data […]

  • Microsoft Excel Course 2013: Suggested Charts through Quick Analysis –

    Thu 18 Apr 2013

    So many times people pick the wrong chart type for their data. There’s a time and a place for pies, and lines aren’t for everyone. Picking the right one takes a bit of thought. The Charts option in the Quick Analysis gallery, a new feature for Excel 2013, allows the user to quickly view and […]

  • Excel 2013: Conditional Formatting through Quick Analysis

    If you’ve got a lot of data, it’s not always easy to spot trends and to easily analyse your figures. Conditional Formatting can instantly show you patterns in your data by highlighting cells that meet certain conditions. So for example you might want to flag up sales below a certain threshold in red, or bold occurrences of […]

  • Get back control of your Excel spreadsheets

    Mon 15 Apr 2013

    Poor Excel skills are costing UK businesses millions in lost revenue. According to an article in the Financial Times more than half of financial service groups have “poorly applied or no controls for managing business critical spreadsheets”. The article blamed losses in part due to “avoidable errors in MS spreadsheets”. So, what could thousands of UK […]

  • Obama, Insourcing and Your (Microsoft) Office

    Fri 1 Mar 2013

    Passing your spreadsheet and database needs to an external company is all too appealing when looking for quick results at low cost. But, is this economically viable or is outsourcing slowing bringing Britain to its knees? Can the US President’s passion for insourcing make Britain Great again? Insourcing is the process of bringing operations back […]

  • What’s in and What’s out in Office 2013?

    Fri 22 Feb 2013

    This week we published an infographic detailing What’s in and What’s out in Office 2013. Click the image to see the full thing…

  • Learn Excel London: How To Display Unique Entries in an Excel List

    Tue 12 Feb 2013

    I used to work with a colleague who maintained a postal mailing list for a brochure we would send out. He used to spend some of his time cleaning up that list by removing repeat entries of customer email addresses who had signed up more than once. “De-duping” he called it. He would block out […]

  • How to: Calculate your age in days and whole years in Excel

    Mon 17 Oct 2011

    This technique can be used to calculate the difference between any two dates.  The worked example shows calculating age and showing this in days and in whole years.  It involves using the TODAY and TRUNCATE functions and nesting several functions together. Create a table for showing date of birth for required people – start this […]

  • Excel Tips: Calculate the weekday from a date

    You can display the weekday for dates stored in Excel.  This is especially useful for checking if due dates fall during the working week.  To do this you need to use the weekday function and custom formatting features of Excel.  The screenshot below are from Excel 2010, but this work in earlier versions too. Ensure […]

  • Excel Tips: Using Autofill for a Custom One-Off Sequence

    Autofill in Excel can be used to repeat a custom sequence. Type in the entries for the sequence into adjacent cells Highlight the entries  Drag down from the Autofill handle until you have the required number of entries 

  • Excel Tips: Using Autofill for a Number Sequence

    Autofill in Excel can be used to complete or extend any number sequence where the gap are equal. Type in the first two number of the sequence in two adjacent cells Highlight both entries Drag down from the autofill handle  Drag until you reach the number of entries you require  When you let go you […]

  • Excel Tips: Mouse Pointers

    If you’re new to Excel, here’s a guide to the different mouse shapes you’ll see, and what they are used for. General Select What it looks like: Thick plus shape.  When you see it: Appears when the mouse is anywhere over the worksheet grid. Why do I need it: Selecting a range of cells by […]

  • Excel 2010 Tips Autofill and Dates

    Autofill is a feature which will copy content down a column or accrss a row.  However it also creates sequences, using the same technique, with things that it recognises as being part of a sequence.  One such is dates. Enter the starting date of your sequence in Excel and ensure it is formatted as a […]

  • Excel training:Calculating with Dates

    Thu 6 Oct 2011

    One of the most asked questions during our Excel 2010 Training Courses has to be the subject of calculating with dates. Excel stores dates (and times) as a number representing the number of days since 1900-Jan-0, plus a fractional portion of a 24 hour day (e.g. 31/10/2011 10:00 is stored as 40847.42).This is called a serial date, or serial […]

  • Change the Colour of Tabs in an Excel 2010 Worksheet

    Mon 26 Sep 2011

    Here’s a brief tip on how to instantly brighten up your Excel spreadsheet with very little effort. By changing the colours of the tabs, your Excel Worksheet will change from being dull and boring to exciting and colourful! It will also help in organization, being particularly useful when organizing all your Excel Worksheets relating to […]

  • Excel Courses – View two Excel 2010 Workbooks at the same time

    Here’s how to view two Excel 2010 workbooks at the same time, side by side, a very useful tip when you want to compare data without having to go back and forth! 1) Open both Excel workbooks 2) Select Window then select Compare Side by Side with (Spreadsheet 2)   3) When you have finished, […]

  • Excel Courses – Filtering Data in an Excel 2010 Worksheet

    When you have an Excel Worksheet with masses of data, it’s not going to be easy to sift through it. So, in order to view sections of data, you can use the filter tool. Select the cells you want to filter (no need to select the column headers), then click the Home tab on the […]

  • Excel Courses – Rotating Text For Better Effects in Excel 2010

    If you want to make your Excel Worksheet appear a little less dull, or maybe you want to draw attention to a certain section of text, why not try rotating the text. And here’s how you can do it.. – Select the cell with the text in you would like to rotate. – Click the […]

  • Excel Courses – Adding multiple rows in an Excel Worksheet

    Tue 13 Sep 2011

    If you want to add more than one row to an Excel Worksheet, drag select the number or rows you want added to the spreadsheet. Then right click on these selected rows, choose Insert from the menu, and the new rows will be added above the rows you first selected.  

  • Excel Courses – Adding Rows or Columns in an Excel Worksheet

    If you want to add a row to an Excel spreadsheet, these are the simple steps you should take: With your mouse, right click on the row header below where you want the new row to be added. Then, click Insert.     Follow exactly the same steps if you want to add a column […]

  • Excel Courses: Hide columns and rows in an Excel Worksheet

    Thu 25 Aug 2011

    If you don’t want part of the Excel worksheet to be visible or when you don’t want certain data to appear in print outs, then a simple solution is to temporarily hide columns and rows. Hide a single column: 1)    Right click on the column header of the column you want to hide (this is […]

  • Microsoft Excel 2010 – Extract Data From a Cell Using LEFT Function

    Wed 24 Aug 2011

    In the following example there is a column of stock codes. The numbers represent our Supplier and the letters after the hyphen (-) indicates our Item number. Suppose we need to extract the Supplier and Item codes and place in separate cells. If our Supplier codes were all equal length e.g. 3 numbers long, we […]

  • Excel Training – Retrieve Unsaved Excel Workbooks

    Thu 28 Jul 2011

    Ever closed an Excel workbook and clicked the “Don’t Save” option, then realised you should have saved it! Microsoft Excel 2010 now has a file recovery option for just such an occassion. This has proved invaluable in our Microsoft Excel Training Courses in London. Always check the AutoRecover time in the Excel options. To do […]


Training courses

Blog Categories

Consent preferences

TrustPilot Score

TrustScore 4.9   |   2365 reviews

TrustPilot Testimonials

Trustpilot

© 2025 STL – Blog

Powered by WordPress

To the top ↑ Up ↑