(In conversation with Jens, one of our Excel/Power BI trainers)
In this post we sit down with one of our training delivery team, Jens, to look at the pros and cons of Excel and Power BI when considering which reporting path is best for you and your organisation.

Jens, you mentioned a frequently occurring question you get in training delivery is – “I need to analyse huge datasets and create reports. Which Microsoft tool is the best? Should I use Excel or Power BI?”- How do you typically respond to this?
I always answer the question the same way. “I do not know because every organisation is different but, in my opinion, Power BI is a far more efficient tool for reporting”.
To answer a question like this, I will need to analyse the client’s business and needs in depth, but I am always happy to help my clients make their own decision. The consequence of a wrong decision can mean days of wasted work and even worse, if the output is inaccurate, very costly decisions can be the result.
That’s very helpful to bear in mind. So if you were to offer some help, what pointers would you share?
Here is a list of my thoughts which I hope can help them make the right decisions and get started in the most productive way.
-
- Take the time to do a good plan.
- Make sure that you know in depth what you need in the output from the data. If you need a very simple output, Excel may be enough.
- Collaborate with colleagues who may need to create reports from the same data set. The options to share data models and collaborate with colleagues are far more superior in Power BI.
- Make sure that you know the “audience’s” expectations and needs. Again, the options are limited in Excel and the needs can change over time so Excel’s limitations could be costly as the report would not be able to display the required information.
- How is your accessibility to the source data? Excel and Power BI have almost the same options to connect to data sources but in Power BI, Python can be used for more advanced options.
- How can the report be created that is flexible so future changes can be made easily and efficiently? If the reports and data model are structured the right way, changes can be made more easily in Power BI.
- Appropriate reports must reflect key business assumptions clearly and accurately without being over-built or filled with pointless details. Whether Excel or Power BI is the chosen application, the danger is that the report can mislead its audience who may make wrong decisions as a result. Microsoft had this in mind when they developed Power BI by developing clear and easily readable visuals, but it is still the report designer’s responsibility to achieve clarity.
- Confidence in a financial report’s integrity can only be achieved with a clear logical structure and layout. It may be easier to create confidence in an Excel report if the organisation is used to using Excel and is confident with its tools.
- How would you and your audience like the report to be presented? Power BI is light years ahead of Excel when it comes to presenting options.
- When and how often should the report be updated? Power BI has features to allow for full control of automated refreshing.
I have in the listed similarities between using Power BI versus Excel.
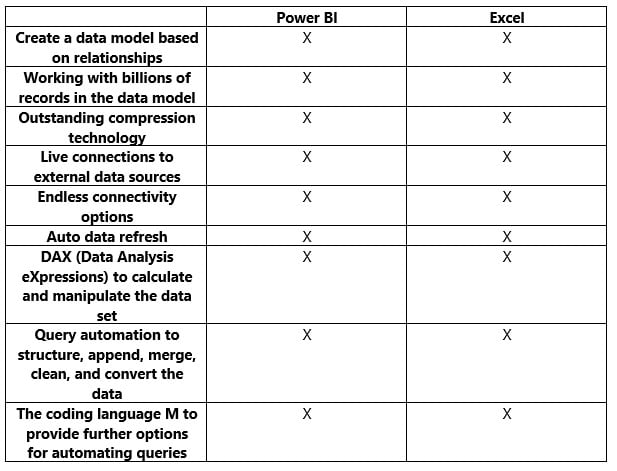
The real difference between using Excel and Power BI to create reports or dashboards from huge multiple data sources is about publishing, visualisation, automation options and how the two tools co-operate with other Microsoft tools. Well, it is also a question about Microsoft’s visions and priorities for the two tools.

Thanks Jens that’s really helpful, so in essence you are saying that whilst the data manipulation capabilities of Excel and Power BI aren’t radically different, when it comes to the creation of reports, that’s where things start to take off with Power BI?
Yes that’s it, and I will now focus on the differences.
Excel:
Visualisation:
The data model can only be visualised in Pivot Tables and Pivot Charts. Information from the data model can be shown on worksheets by using Cube functions.
Publishing:
Like other Excel files, you can share a workbook, but you have no more high-level options.
Automation options:
Compared to creating the data model in Power BI, there are fewer possibilities in Excel to automate tasks and create your own tools.
Co-operate with other Microsoft tools:
If the data model is created in Excel, the data model can only be used in the file containing the data model. An Excel data model can be imported to Power BI but the data cannot be refreshed.
Microsoft has developed many new tools on the 365 platform which co-operate with Power BI data models and not Excel.
Microsoft’s visions and priorities:
We get a completely new version of Power BI every month, whereas Microsoft has not updated Power Pivot (the data modelling tool in Excel) for years. Everything points in one direction: Power BI is the future.
Wow! That’s certainly impressive and I’ve heard that Power BI users can even suggest and vote for new features?
Yes that’s correct, the investment Microsoft have put into power BI over the last few years is really incredible! Now I want to continue and share some of the differences you find in Power BI.
Power BI
Visualisation:
If you like Pivot Tables in Excel, the matrix tool in Power BI can do the same. The options to visualise your data in Power BI are outstanding. You have several options to add interactivity to your reports. The design options are far better than the those in Excel. You have artificial intelligence in Power BI which can cross analyse the data set and visualise key indicators. It is like comparing a stone against mount Everest when comparing visualisation options in Excel against Power BI!
More advanced and sophisticated filter options than you will find in Excel.
By downloading an Excel Power BI add-in, charts, tables, and everything else created in Excel can be visualised on a Power BI dashboard and published.
Publishing:
You can publish your Power BI report to someone inside your organisation and outside. You invite them through their email address. The invited audience can then see the online report live in real time. Power BI reports can be watched on mobile devices. From published reports, dashboards can be created. Dashboards are tailored from one or many reports. This is ideal if someone needs information from many reports or only needs key information from one report. When a report is published you can give colleagues access to create reports from the same data model.
Restrictions can be made in Power BI (called row level security). You can tell Power BI that when you invite a specific person to view your report, you only want this person to be able to see information about the London sales team and another person only to be able to see information about the Manchester sales team, for example.
If you have 25 sales teams, create the data model in Excel and you want the same restrictions (ie. you only want the sales teams to be able to see their own data), you will need to create 25 Excel files, 25 data models, and in all 25 models you will need to remove the data from the 24 sales teams who you don’t want to give access to!
Just in the above example, sharing the report could easily be the difference of minutes in Power BI vs hours in Excel. Imagine the boost in productivity by choosing the right tool!
Again, it is like comparing a stone against Mount Everest.
Automation options:
Python and R Scripts can be used for more advanced automation options and for creating your own visualisation tools. Python can also be used for more advanced connectivity options.
Co-operate with other Microsoft tools:
Microsoft has developed many new tools on the , which co-operate with Power BI and not Excel.
An example is the Form tool in 365. You can create a form and when someone fills it in, the information goes straight to the data model and your Power BI report.
Microsoft’s visions and priorities:
The effort and time Microsoft puts into Power BI can, in my eyes, only mean one thing. This is the future and here Microsoft wants us to create our reports.
Pros and cons – Excel versus Power BI as a reporting tool.
Pros
-
- Most organisations already have a lot of Excel knowledge.
- No extra costs or training may be needed.
Cons
-
- Very limited options for visualisation.
- No options for publishing.
- Data model cannot be shared.
- Very few Excel users know about data modelling in Excel and training may be needed.
- It doesn’t seem like Microsoft spends much energy to develop the options in Excel.
Power BI
Pros
-
- Endless number of visualisation options.
- More advanced and sophisticated filter options than you will find in Excel.
- Publishing online.
- Better control of who can see the reports.
- Reports and dashboard can be viewed live on mobile phones and tablets.
- Artificial Intelligence used to provide insights into datasets.
- One data model can be used for many reports.
- One data model can be shared within the organisation so many users can create reports from the same model.
- The data model is protected so no one can change it by mistake.
- Data access restrictions can control how much information each user can see.
- Many options for interactivity between different visualisations.
- Tailored dashboards can be created from one or many reports.
- Excel items can be used on dashboards.
- Python and R Scripts can be used.
Cons
-
- There are costs to be consider if you need Pro License or Premium License options.
- You will need a 365 platform to get all the benefits from Power BI.
Jens, this has been a really comprehensive step through the data reporting capabilities of both Excel and Power BI, so thank you! In summary then and with your experience where do you see things heading?
I have taught Excel for more than 20 years, data modelling for about 10 years and Power BI for the last 5 years and in my opinion Power BI has revolutionised reporting.
All reports should be and can be created fully automated whether you choose to do it in Excel or Power BI.
Many of my clients spend days every month creating reports in Excel. However, they may not know the options to automate the process, saving them possibly months in a year!
Should we create our reports in Excel or Power BI?
If your organisation wonders if it is worth investing time and money going from Excel reporting to Power BI, my short answer is – ‘yes’!