Excel has some powerful tools that you can use to carry out a What-if analysis.
We sat down with one of our Excel Experts, Jens, to ask him about three particular data analysis tools and to see whether he would demonstrate how to use them for us.

Good morning Jens, you talk a lot about “what-if analysis”. To the beginner like me, could you explain what that means?
Excel offers three What-If Analysis tools that allow users to discover different scenarios and evaluate the effect of changes on their data. These tools help in analysing the possible outcomes based on different input variables values.

Thank you, that’s clear enough. Would you mind starting by telling us what those three tools are?
The Scenario Manager
The first one, the Scenario Manager, allows users to create and save different sets of input values that can be applied to a worksheet. By defining multiple scenarios, users can quickly switch between different sets of data and observe the resultant changes in calculations, formulas, and charts.
Great, and thank you for the detail
Goal Seek
Next, Goal Seek is a modest sensitivity analysis tool in Excel. It allows users to determine the input value needed to succeed a desired result. The Goal Seek tool can work with changes in one variable. By specifying a target value, Goal Seek will find the input value that will produce the desired outcome based on a formula or calculation.
I can certainly see the value in that too!
Data Tables
The final tool, the Data Table, is also a sensitivity analysis tool in Excel enable users to perform multiple calculations simultaneously by changing one or two input variables. By creating a data table, users can explore different combinations of input values and observe the resulting calculations. Data Tables are specifically useful for analysing the effect of changing variables on complex models or large data sets.
So we can start to see a difference between the three tools from your explanation there. Particularly around when each one would be the most useful. Could I ask you to run through the three tools in a bit more detail, perhaps you could demonstrate how to use them in an example context?
What if Example 1 – The Scenario Manager
Of course. For the Scenario Manager, imagine that you have projected how many projects our company is going to run next year. Also, you have estimated the profit. But there are many uncertainties you want to consider. Your sales department has provided you with both good news and bad news. One of your VIP clients may be going to one of your competitors, but good prospects of getting some huge new clients can also affect your projections.
A planned marketing campaign end of this year can also have an impact on your projections.

In this example the projections are 100 projects, with estimated average revenue for each project of £25,000 which results in £2,500,000 estimated total revenue – if you look at row 4 here on my spreadsheet.
20 employees are needed for the 100 projects with an average salary of £50,000 a total of £1,000,000 – this data is in row 7.
There is a fixed cost of £500,000 in row 10.
All projects are overseas, and it is not decided yet if the employees are going first class or economy class so both options are in the model. The profit is calculated to £510,000 if the employees are going first class and £750,000 economy class, as you can see from the £2.5m total revenue – the salary cost – fixed project costs – travel/ accommodation costs.
To build What if scenarios based on this model, you need to open the Scenario Manager.
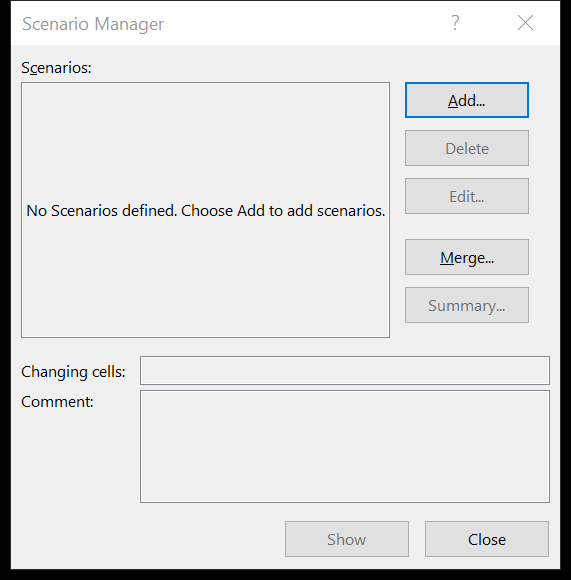
Click Add and name the scenario. You will then need to tell the Scenario Manager which cells you would like to be able to change.
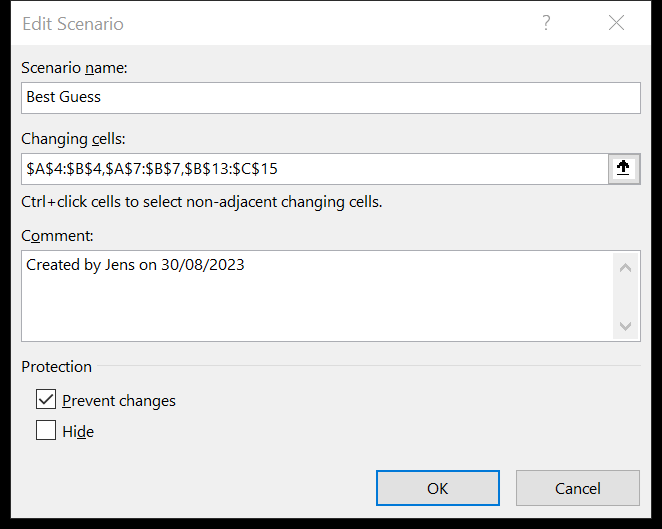
In this example you would like to change number of projects, average revenue, number of employees, average salary, ticket cost, hotel cost, and food cost.
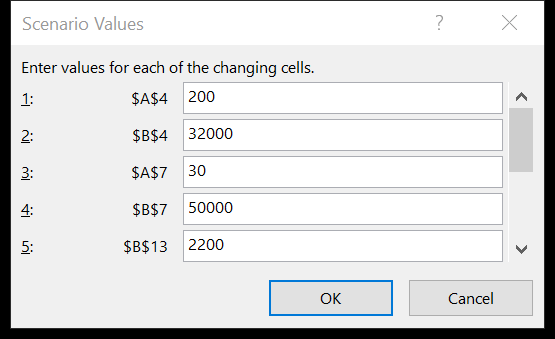
The numbers in the model are the best guess scenario and it is very important that you keep the numbers you have in the model unchanged in a scenario otherwise you cannot get back to the scenario again later. When you click OK, you get the Scenario Values dialog box in which you change the changeable cells in your model.

To create a new scenario just click Add:
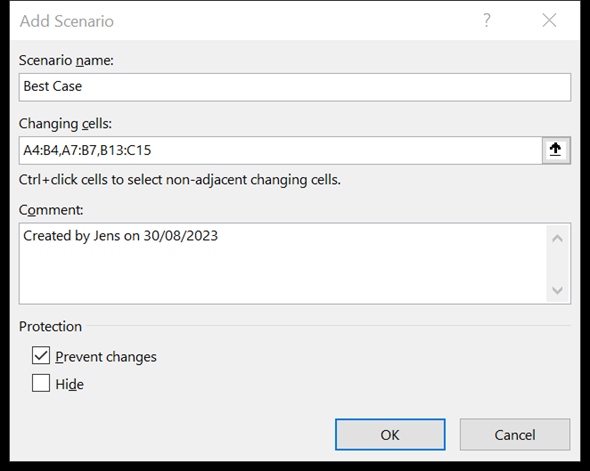
Once you’re here, name the scenario click OK and enter the new values.
You can create any number of scenarios. In this example a Best Guess, a Best Case, and a Worst Case scenario have been built. To show the different scenarios select the scenario and click Show, and the model will show the values entered in your model.

That’s great! Thank you for breaking it down as you have for us. It makes perfect sense. And thank you for demonstrating it in a way which aligns with how I would use this tool. Shall we move on to Goal Seek?
what if Example 2 – Goal Seek
Okay. So using the same scenario, you have decided to use the economy class ticket option because your target profit next year is £2m.
The Goal seek tool can help you to understand what you will require to reach this target.
First, how many projects are needed. If I open the Goal Seek tool. The Set cell is the cell reference of the cell with the formula calculation the profit. Here it is B20. Enter the target (£2,000,000) in the “To value box”. In the “By changing cell” box, you can enter the cell reference of the cell you want goal seek to change. Here it is A4 where the number of projected projects is entered.
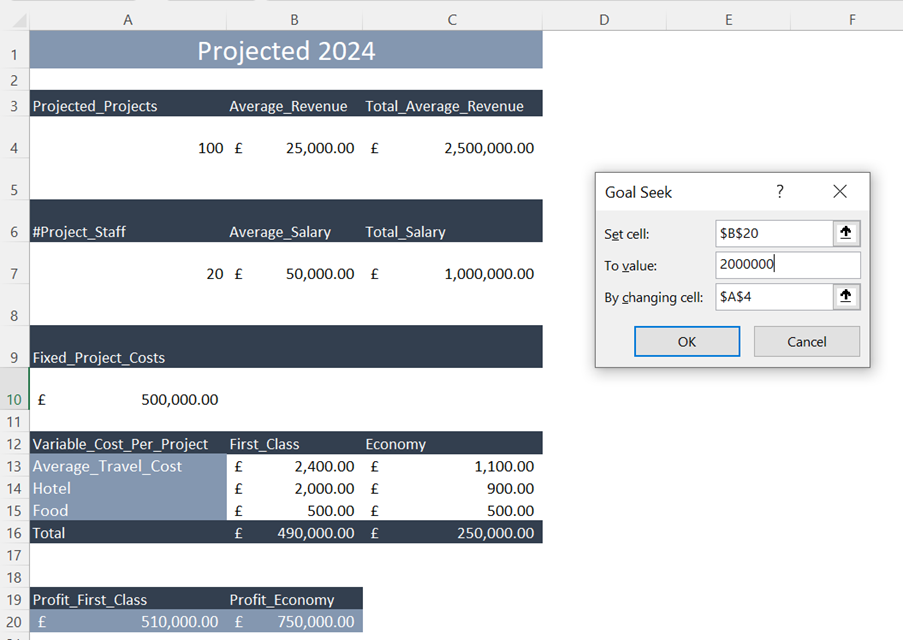
Now I just click OK, and the model shows in this example, that 156 projects are needed to reach the target.

Instead of looking at number of projects required, you could also find out how much the average revenue needs to increase to reach the target. You will just have to change the “By changing cell” reference.
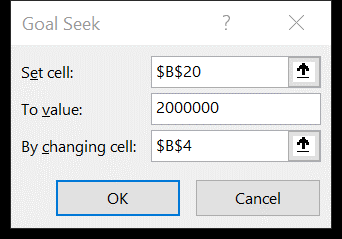
And the model shows that an average revenue of £37,500 will get you to the target.

Amazing how much you are able to affect the data with such small changes, I can really see the value of this one too! Can we look at the third and final tool?
What if Example 3 – Data Tables
That would be the Data Tables. These can work with either one or two variables. We will be using 2 variables in this example.
We want to see how changes in the number of projects and changes in the average revenue will affect the profit.
To create a Data Table, you will have to enter the values you want to investigate in the cell next to the formula and across (here it is number of projects), and in the cell just under the formula and down (here it is average revenue). Select the whole range and open the Data Tables tool.
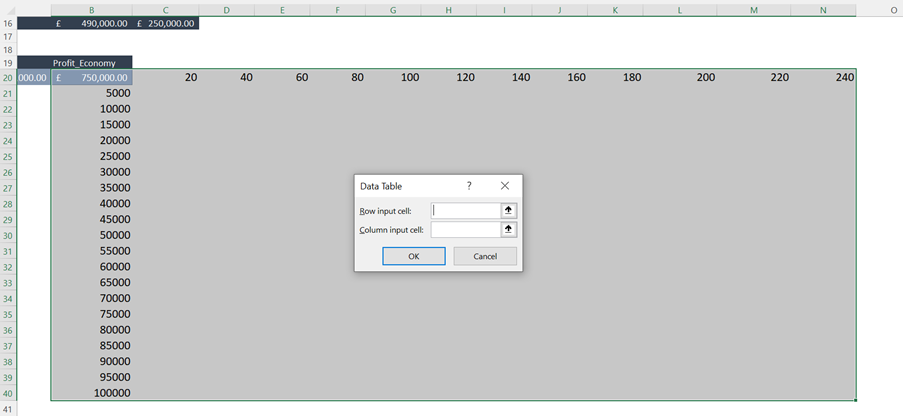
The Row input cell here is A4 and Column input cell B4.
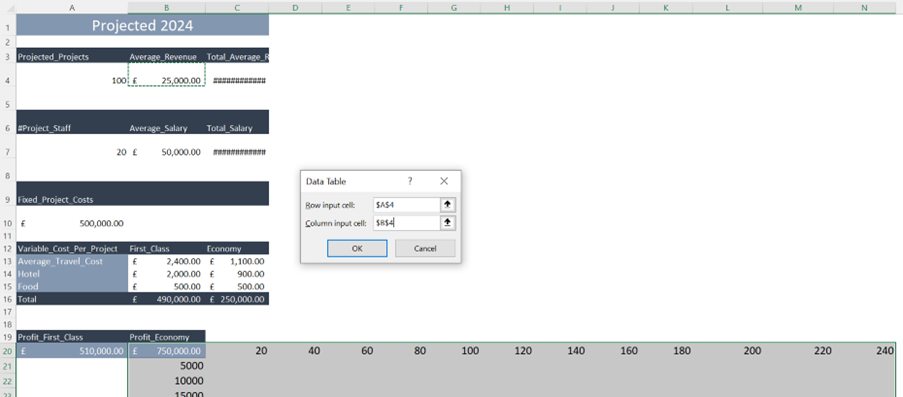
Click OK and the Data Table tool will now show the profit based on all the values entered.

Conclusion
It sounds to me Jens, that these are tools which many people will use on a daily, weekly, monthly, quarterly and/ or annual basis depending on industry and scale. I can certainly see the benefit of them when we are looking at data and trying to think holistically about our impact on the business!
Yes, the What-if analysis tools are very useful. Especially in forecasting models. Every time you have a calculation or a model in Excel and you have thoughts or questions like:
What if we raise our prices by 5%?
And what if we were to employ more people?
What if the fuel prices increase?
Whatever question which should popup when you look at your Excel models, the What-if analysis tools can help you gaining clarity of how changes can affect your models.