
Excel is a brilliant tool for data analysis.
A useful function or two can help, as several factors can impact your data. Weather, conflicts around the world, inflation, the interest rate, currency rates, subcontractors, number of customers, competitors, special offers, market size etc.
Trend Function and Regression Tool
In this blog post, we’ll be looking at the TREND function and the REGRESSION tool from the ANALYSIS TOOLPAK and how you can use them.
In this example, expected key influencers on sales numbers are marketing expenses, how many salespeople, number of sales calls, and the dollar value. Many clients are in the USA.

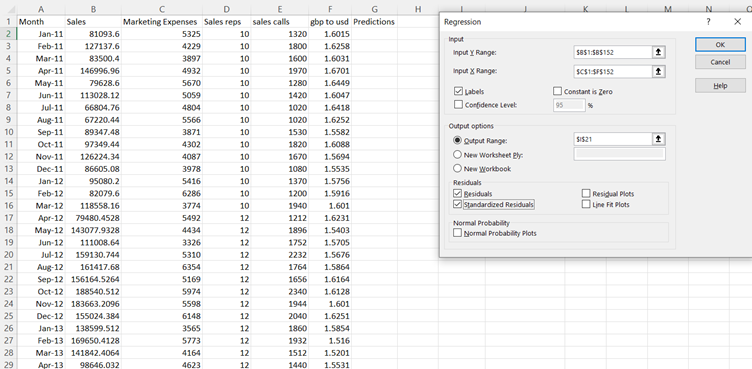
At this point, it is a clever idea to analyse if these key influencers are the right variables to get accurate estimates. You can do this with the REGRESSION tool from the Excel ANALYSIS TOOLPAK.
In the Regression dialog box, enter the range of your y-values (dependent variable) in the Input Y Range field. Enter the range of your x-values (independent variable) in the Input X Range field. Check the “Labels” box if your data has column labels.
Choose an output location for the results of the regression analysis. Check any additional output options you want to include, such as confidence intervals or residuals. Click OK to run the regression analysis. The results, including the slope, intercept, R-squared, and other statistics, will be displayed in the output location you chose.
The F-Test
The F-Test of overall significance in regression is a test of whether your linear regression model provides a better fit to a dataset than a model with no predictor variables. Linear regression needs the relationship between the independent and dependent variables to be linear. The significance “F” gives you is the probability that the model is wrong.
Highlighted in the below screen grab. We want the significance F or the probability of being wrong to be as small as possible. Smaller is better. Many mathematicians agree that a significance F > 0.005 indicates that the model is wrong. This would mean that the data set cannot be treated as linear.
The significance F in the output report is almost nothing. It indicates that the linear approach is correct. Next step is to identify if all the independent variables are significant for an accurate estimation. The P-Value will tell you.

The P Value
A p-value < 0.05 is good. A p-value< 0.05 means there is a 5% probability that there is no relationship between the variables.
The p-value for the independent variable GBP to USD is 36% which means that there is a 36% probability that there is no relationship between the variables, and for the accuracy of the predictions it should not be taken to account.
The other 3 independent variables return a low p-value and are closely related to the sales and will be important for the estimation of the sales.
The report also shows the slopes.
| Marketing Expenses | 7.753195112 |
| Sales reps | 16171.55994 |
| sales calls | 94.93927718 |
Each pound spent on marketing returns in average 7.75 pounds in sales, 1 sales rep returns in average 16,171 pounds in sales, and each sales call returns in average 95 pounds in sales.
The Trend Function
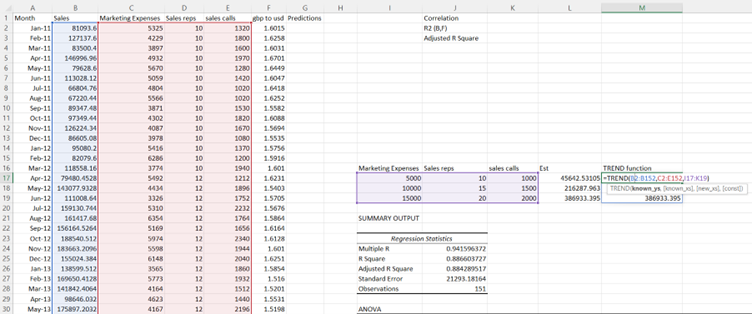
After finding the independent variables which are important for accurate estimations you can use the linear regression equation to calculate your predictions, but you can also use the TREND function.
The formula for simple linear regression is Y = mX + b. Where Y is the response (dependent) variable, X is the predictor (independent) variable, m is the estimated slope, and b is the estimated intercept.
We have completed the regression report again. But this time, without the unreliable independent variable GBP to USD and the corrected slopes can now be used in the linear regression equation.
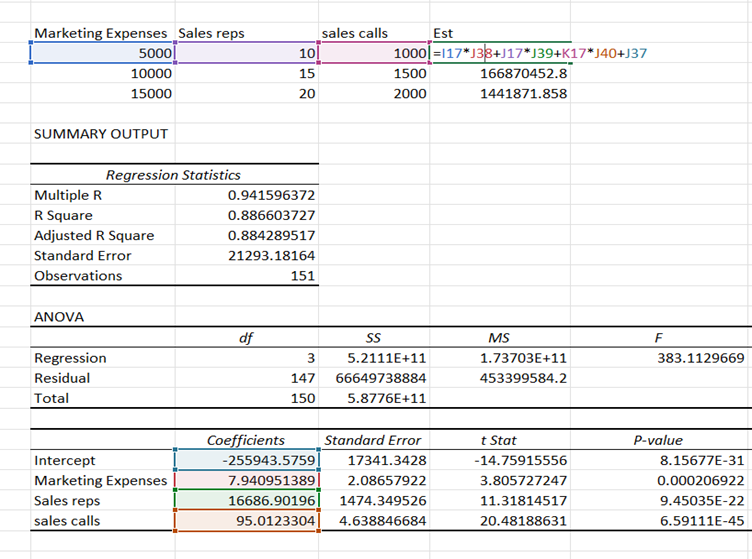
In this example, we are calculating estimated sales based on 5000, 10000, 15000 spent on marketing, and 10, 15, 20 sales reps, and 1000, 1500, 2000 sales calls.
When the right independent variables have been recognised by the regression report you will not need the report to give you the slopes.
The regression report has recognised the correct independent variables. Once this has happened, you will not need the report to give you the slopes.
The TREND function will calculate the slopes for you and return the same estimates as the equation.
Conclusion
Excel is a fantastic tool for data analysis. Here we shared an example of linear data regression. You can also find tools to analyse and create estimates for all kind of data sets in Excel.