I can use What If analysis, how can I make this even better?
In Part 1 we learnt how to create a simple What if parameter in Power BI. However, you will have more options for analysing your data if you create the parameter tables yourself. This lets you not only work with nonlinear incremental changes (0, 1000, or 1000000), but you can also have more than one column in the table. This is great because in enables you to compare the different scenarios side by side, for even more compelling data analysis.
What is a parameter table?
A Parameter Table is useful when you want to add a slicer and make it change the results of calculations/measures. You achieve this by inserting parameter values into DAX expressions.
It is important when doing this that you define a table that has no relationships with any other tables. Its only scope is to offer a list of possible varieties to the end user so they can modify the calculations performed by one or more calculations/measures.
The DAX expression in calculations/measures uses the value selected and calculates the result accordingly.
How do I use a parameter table in DAX?
In this example, parameter tables are used for next year projections. A matrix shows current year’s profit for the 6 products we are selling. We want the end users to see what next year will bring if the variable price changes.
To create a parameter table click Enter Data on the Home tab in the Data group.
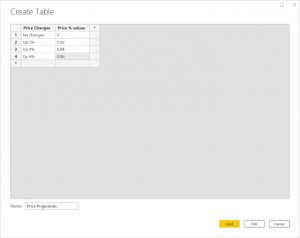
Here the table is called Price Projections with two columns. One column will be used as headers in the visuals, the other with the values in the DAX calculations/measures.
The next step is to create the measure from the values in the Price Projections table. In the DAX below you will see an If is used to test if only one value is selected (the HASONEVALUE function).
On slicers we can do a multiple select, but this will give us a problem, because we only want the slicer to pick up one value from the Price Projections table. The logic in the DAX is that if one value is selected on the slicer, multiply the profit with the value from the Price Projections table, plus 1. If more values are selected on the slicer return the profit only.
Price Projections =
IF (
HASONEVALUE ( ‘Price Projections'[Price Changes] ),
[Profit]
* ( 1 + VALUES ( ‘Price Projections'[Price % values] ) ),
[Profit]
)
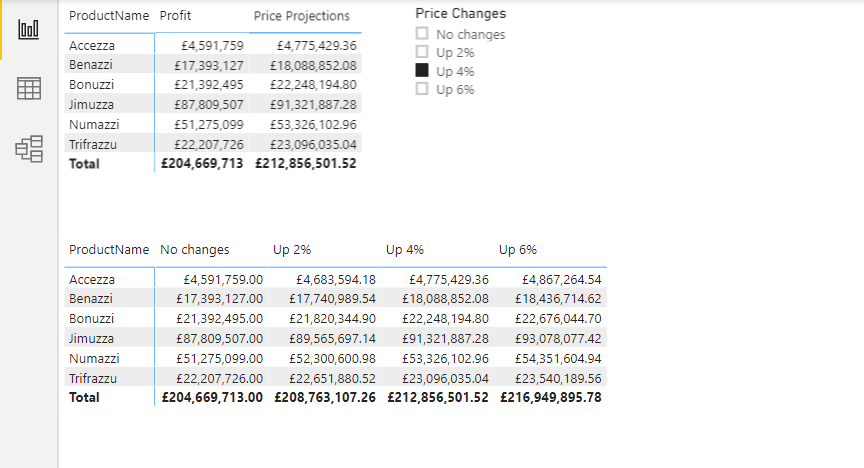
In the example below you can see the DAX measure added to the matrix and a slicer created from the field Price Changes from the table Price Projections. Now the matrix will be filtered from the value selected on the slicer.
On the second matrix different scenarios are displayed by using the field Price Changes from the table Price Projections and the DAX measure as value.
Conclusion
Creating insightful scenarios in Power BI can help you make powerful business decisions quickly. At STL we offer a range on Power BI training courses, for complete beginners to advanced users, so get in touch to find out more!