Why use What if?
Have you ever wanted to quickly demonstrate how your data changes in different scenarios? The What if parameter in Power BI is a powerful tool that allows you to do just this, by dynamically transforming your data.
For example, maybe you want to know how much your profits will increase if you raise your price by either 2%, 4% or 6%? Or show the effect of spending more money on marketing? If you know the correlation between price, marketing and profit, you can quickly compare these scenarios and ensure you make the right choice when making critical business decisions.
How do I use What If?
The scenario:
Imagine you want to visualise how the sales total will change if you sell more units. 5%, 10%, or 15% more.
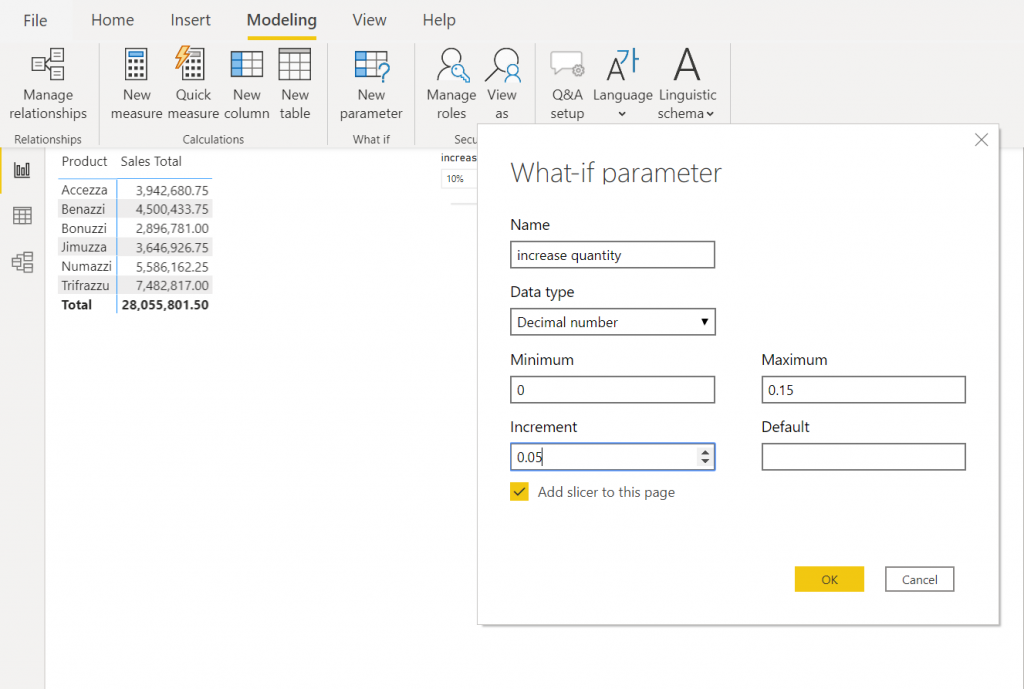
Step 1: Use a matrix to visualise the sales total for each product. Click New Parameter on the Modelling tab, which will open the What-if parameter dialog box. Type a name and data type, in this example the data type will be Decimal number. Type a minimum, maximum and the incremental changes, in this example 0.05 (5%) and click OK.
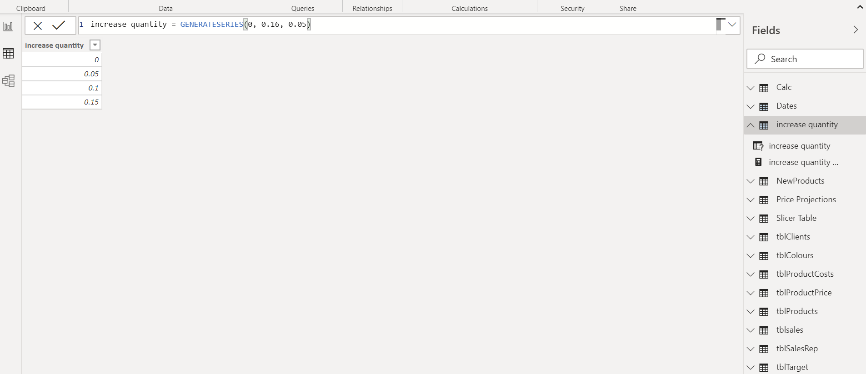
This will insert a new table, called a parameter table, in your Power BI file and a slicer on your report page.
If you have a look at the new table in Data view, you will see the values.
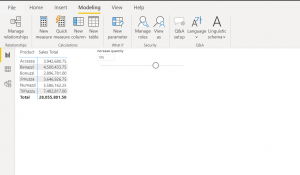
And if you look at the report page you will see the slicer. Try dragging the handle across and see how the value will change from 0% to 15%.
Step 2: Create a measure you can use to visualise the percentage changes of the quantity.
Start by multiplying the price with the quantity, and then multiply with 1 plus the selected value from the increase quantity table (the parameter table).
Increase quantity =
SUMX (
tblsales,
[Quantity] * [Price] * ( 1 + ‘increase quantity'[increase quantity Value] )
)
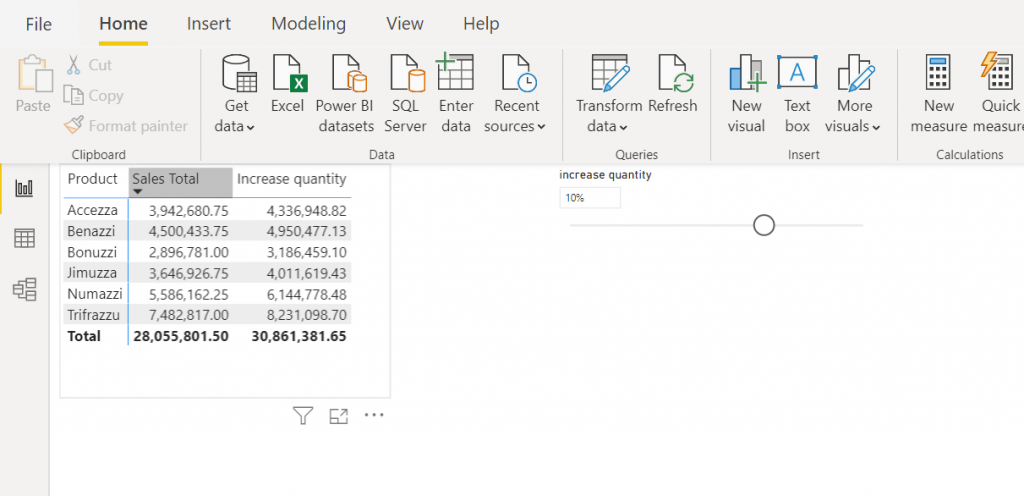
By adding the measure to the matrix you can now see how it will change the total sales if the quantity increase with 5%, 10%, or 15% – simply drag the slicer across.
Conclusion
Here you have learnt to create a quick and easy What If parameter for dynamically transforming your data in Power BI. Read Part 2 to learn how to personalise your parameter further to give even more powerful insights, or check out our Power BI training page to find out how you can learn even more skills in this amazing reporting tool!