With the Analytics Pane in Power BI, you can quickly and easily make dynamic reference lines, which can be extremely helpful when analysing data and making key business decisions. From simple trend lines to more complex forecast lines, there are so many options to choose from!
First, find the analytics pane by going to the visualizations pane:
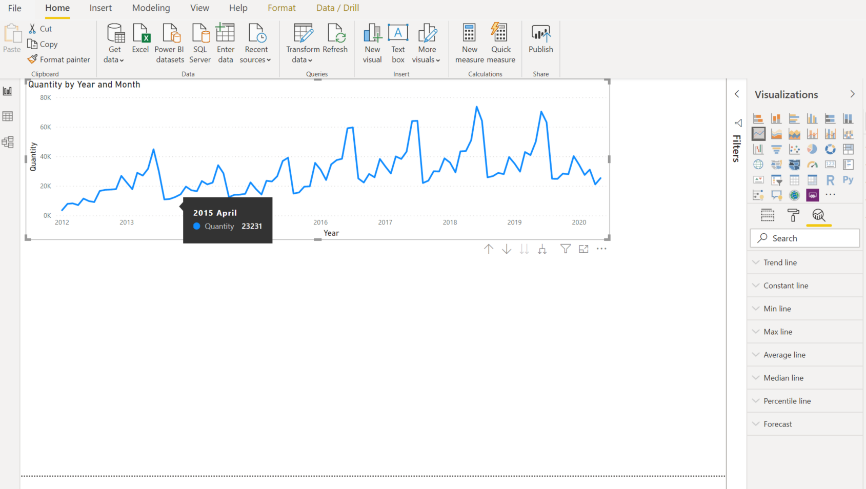
The Trend line
If your data “jumps” up and down it can be difficult to see if you have a positive or negative trend, so here a trend line is handy.
To add a trend line:
- Select your visual
- Click on the down arrow before the trend line option
- Click add on the analytics pane
The settings/options will then appear and you will see the trend line on your visual.
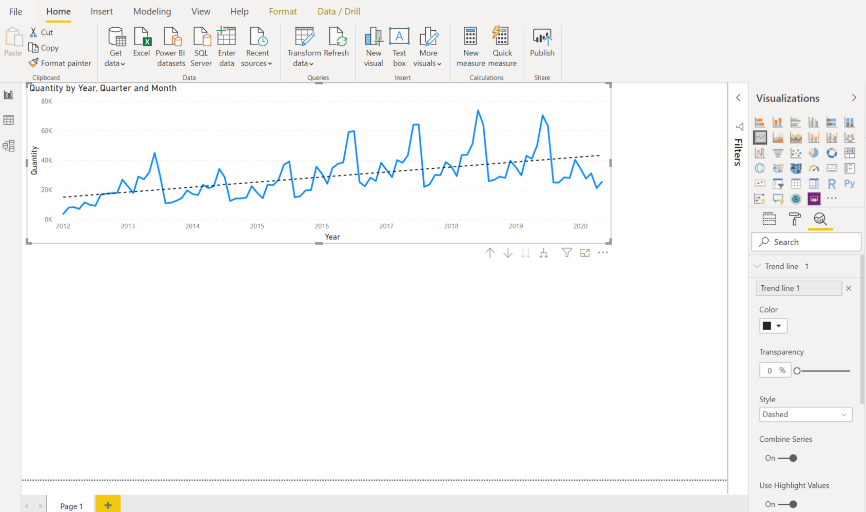
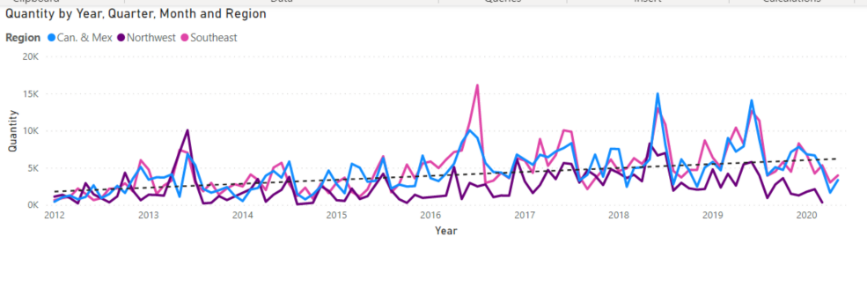
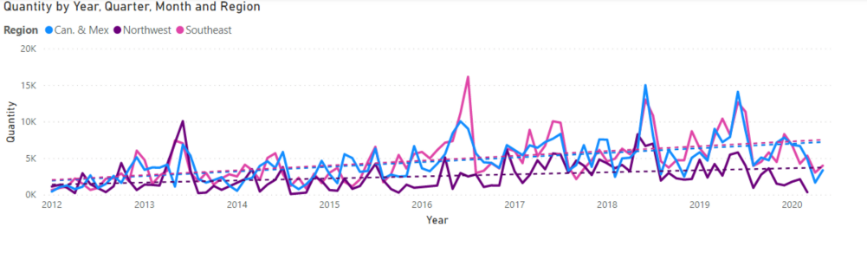
With all lines, you have the option to change the colour, style, and transparency. If you change the Combine Series option in the Trend Line setting to Off, it will display a trend line for each subcategory, which is useful for drilling down into the data.
Combine series On:
Combine series Off:
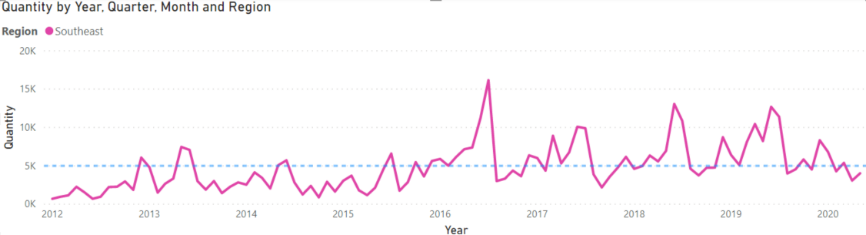
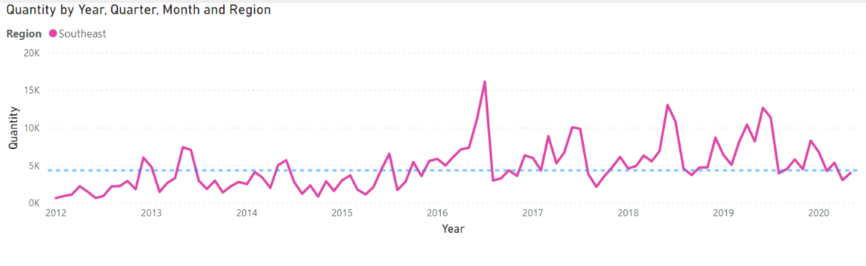
The Constant line
A constant line can be very useful, for example if you have a target and you want to see at a glance if your values are below or above the target.
To add a constant line:
- Select your visual
- Click on the down arrow before the constant line option
- Click add on the analytics pane
- Enter the value for the constant line
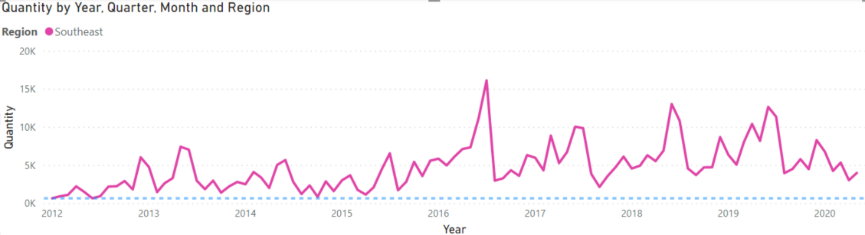
The Min line
The Min line will add a line showing the lowest value on the visual, and again you have the options to change the colour, style, and transparency.
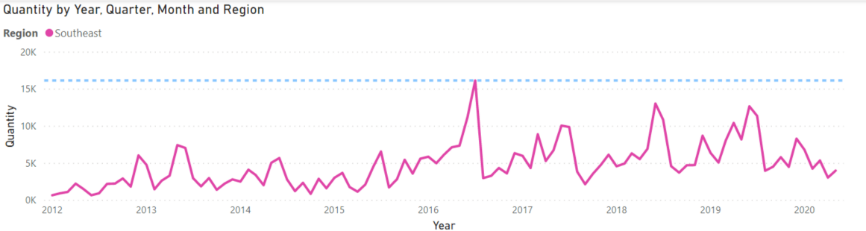
The Max line
The Max line shows the highest value on the visual.
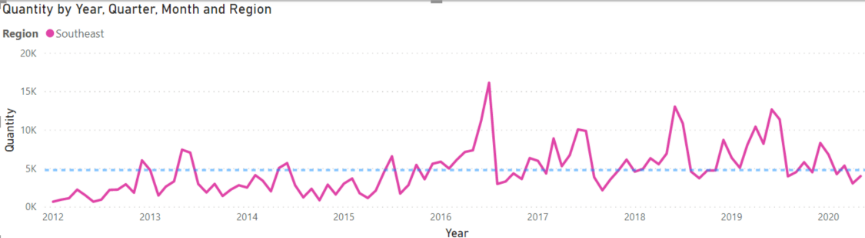
The Average line
The Average line shows the calculated mean average of all the values you have on the visual, which is great for showing the variation.
The Median line
The Median line will add a line showing the median of all the values you have on the visual.
The Forecast line
The Forecast line is very useful, especially if your data displays seasonality. Power BI is very good at handling complex levels of periodic seasonality, the only limitation is your date table. Fortunately, if you have week number, financial year, financial quarter, financial month, or other periodic breakdowns in your date table, they can all be used to visualise seasonality and forecast very accurately.
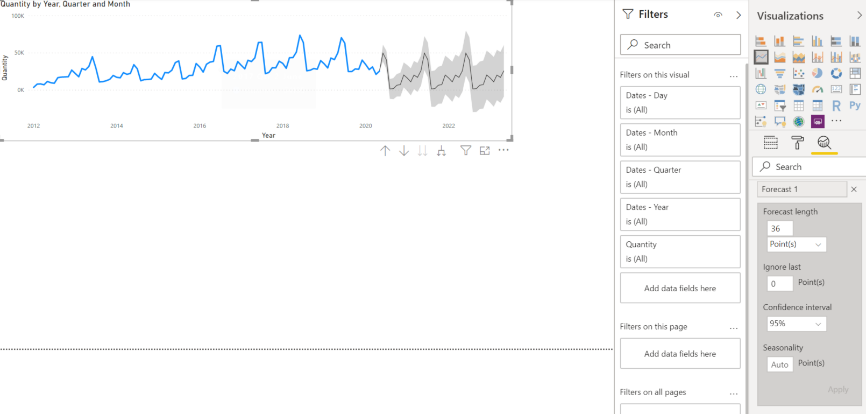
Sometimes, you may look at your forecast and doubt how accurate it is. For example, in the visual above the forecast shows a decrease over the next 36 months, but this is wrong. The issue is that we haven’t received all the data for the last three months, and this is having a negative effect on the forecast. Luckily, there is an easy way to fix this – you can ignore points!
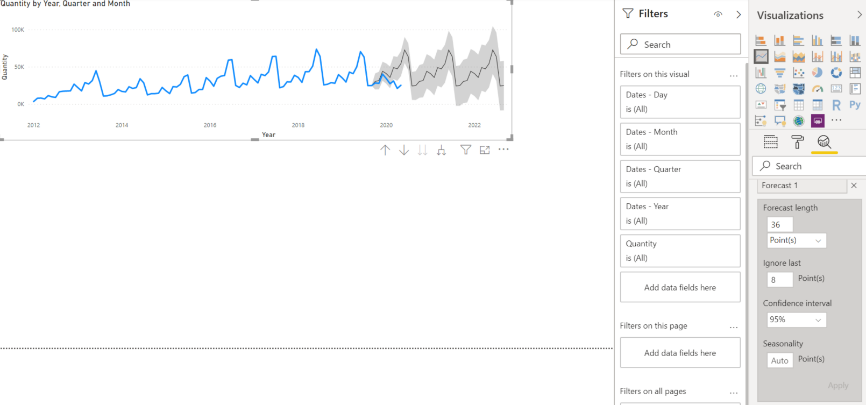
In the example above, 8 points (8 months) have been ignored. This not only takes care of the issue, but also allows you to see how close your forecast line fits your actual values. This will give you a clear indication of the forecast line’s accuracy
Also, the confidence level is set to 95% and the seasonality to Auto. The confidence level is displayed on the visual by the grey area around the forecast line. Why Auto? This means if you change the visual, Power BI desktop automatically picks up the seasonality (4 if looking at quarters, 12 if looking at years).
Conclusion
Creating insightful scenarios in Power BI can help you make powerful business decisions quickly. The Analytics Pane and the amazing tools inside it are just one small area of this incredible application.
At STL we offer a range on Power BI training courses, for complete beginners to advanced users, so get in touch to find out more!