Skip to the content
STL - Blog
Best in-class training – Be delighted, not just satisfied
  • STL Home
  • Blog home
  • Professional & Management
    • Leadership Development
    • Management Training
    • Professional Development
    • Project Management
    • Sales & Customer Service
    • Soft Skills
  • Application
    • Artificial Intelligence
    • Hints & Tips
    • Microsoft Office
      • Access
      • Copilot
      • Excel
      • Excel Data Visualisation
      • MS Project
      • Office 365
      • Outlook
      • PowerPoint
      • VBA
      • Visio
      • Word
    • Microsoft Office Resources
    • Power BI
  • Misc
    • Infographic
    • Technology
    • Fun
    • Company News
  • About us
  • Contact us

Excel Training Resources

Explore in-depth tutorials and strategies for data management, analysis, and visualisation using Microsoft Excel.

  • Create Stunning Charts in Excel and Impress Your Clients

    Create Stunning Charts in Excel and Impress Your Clients

    Fri 17 May 2024

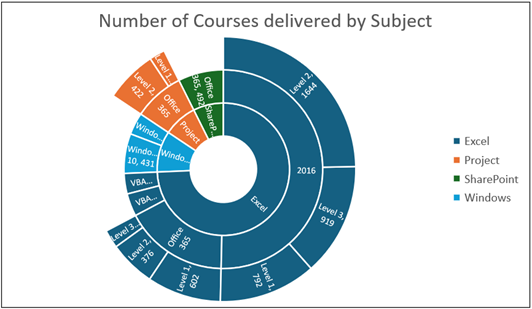
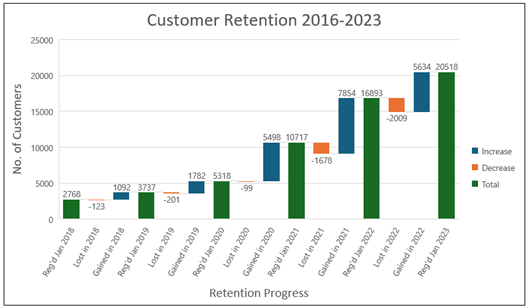
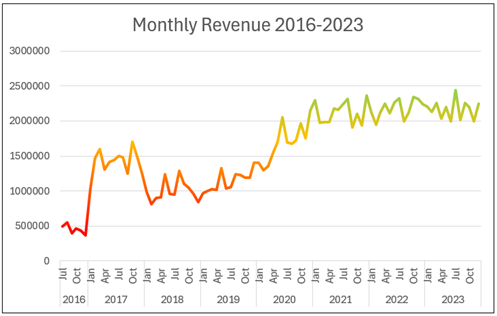
    Data can be a powerful tool for driving business decisions, but a ‘sea of totally unrelated data’, when presented, can confuse your audience. However,  you can make a huge impact by  presenting that data clearly, using captivating visuals that tell a compelling story. This guide will equip you with the skills to leverage the data […]

  • Unleash the Power of Your Data: A Look at Excel Power Pivot

    Unleash the Power of Your Data: A Look at Excel Power Pivot

    Fri 10 May 2024

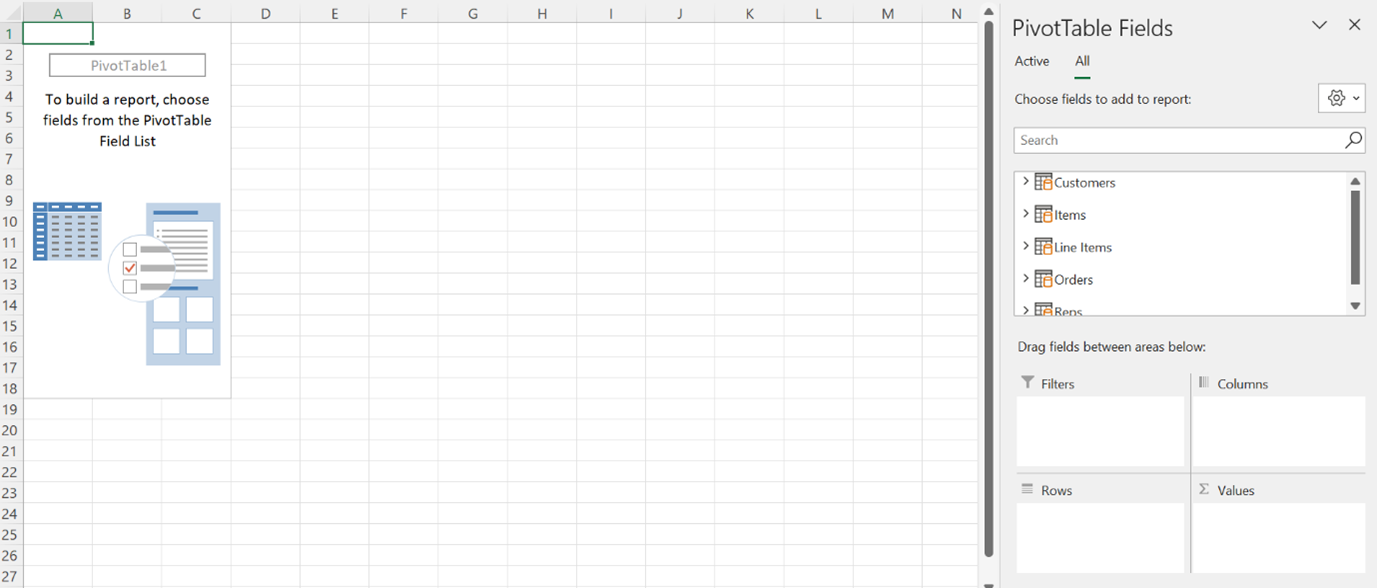
    Ever feel limited by traditional Excel PivotTables? Microsoft Power Pivot offers a revolutionary solution, empowering you to analyse vast amounts of data from diverse sources, all within the familiar Excel environment. Break Free from Limitations Say goodbye to the constraints of single-table analysis! Power Pivot empowers you to: Consolidate Data: Effortlessly integrate information from various sources, […]

  • Streamline Data Analysis with Excel Dynamic Arrays Feature

    Fri 1 Mar 2024

    In Excel 365 and Excel 2021 Microsoft has provided Excel users with some new features which will fundamentally change the way worksheets are designed. Dynamic array formulas allow you to work with multiple values at the same time in a formula. Dynamic arrays solve some challenging difficulties in Excel and will be a feature which […]

  • Power BI – Dynamic Text for More Detailed Reports

    Tue 30 Jan 2024

    Visualising data is crucial for decision making in any industry. Power BI reports are a brilliantly efficient way to achieve this, as users have several useful visual options. In this blog post you will learn how Power BI can display dynamic text for more detailed reports. We will be using examples of sales data and […]

  • Excel Data Visualisation: A Powerful Decision Making Tool

    Mon 15 Jan 2024

    Data visualisation is a powerful tool that allows you to view data more clearly. This is vitally important for businesses to help them with crucial decision making. What is data visualisation? Data visualisation is the process of turning raw data into graphical representations. It works by taking selected data in Excel and then choosing from […]

  • How to Use Sparklines in Excel to Visualise Data Trends

    Wed 10 Jan 2024

    Sparklines are a powerful tool in Excel that allow you to visualise data trends in a condensed chart format. Unlike normal Excel charts, Sparklines are embedded in a single cell, making them ideal for displaying trends in sales figures, website hits, and other data over a period of time. In this blog post, we’ll show […]

  • Excel – Linear Estimations for Better Decision Making

    Thu 21 Dec 2023

    Excel is a brilliant tool for data analysis. A useful function or two can help, as several factors can impact your data. Weather, conflicts around the world, inflation, the interest rate, currency rates, subcontractors, number of customers, competitors, special offers, market size etc.   Trend Function and Regression Tool In this blog post, we’ll be […]

  • What-if analysis in Excel

    Wed 13 Dec 2023

    Excel has some powerful tools that you can use to carry out a What-if analysis. We sat down with one of our Excel Experts, Jens, to ask him about three particular data analysis tools and to see whether he would demonstrate how to use them for us. Good morning Jens, you talk a lot about […]

  • Macros: A Hidden Time Saver in Excel

    Tue 14 Nov 2023

    here we share the much-overlooked Excel Macro feature – and how it can save you considerable time every day. How do Macros Work?   The Macro Recorder in Excel is a useful tool that allows users to automate repetitive tasks by recording the steps. The Macro Recorder generates Visual Basic for Applications (VBA) code. It […]

  • Productivity win: Excel MAXIFS & MINIFS functions (4 of 4)

    Fri 4 Aug 2023

    This blog is part 4 of a series that explores the amazingly useful functionality of some of the most popular Office 365 Excel functions. In the previous blog, the focus was on the UNIQUE function. Building on this, we will explore how useful the MAXIFS and MINIFS functions are in finding the highest or lowest […]

  • Be more productive with Excel’s UNIQUE function (3 of 4)

    Tue 1 Aug 2023

    This blog is part 3 of a series that looks at the amazing functionality of some of the most popular Office 365 Excel functions. In parts 1 and 2 the focus was on the FILTER and SORT functions. Building on this, we will explore how useful the UNIQUE function is in creating  unique lists more […]

  • Excel – The Power of Custom formatting

    Fri 14 Jul 2023

    Most Excel users do not know the power of custom formatting. They know how the currency or accounting format. In this article you will find some useful information which can display your data in different ways, and more clearly. I got the inspiration to write this blog post from a client question on one of […]

  • Be More Productive With Excel’s SORT function (2 of 4)

    Thu 22 Jun 2023

    This blog is part 2 of a series that looks at the amazing functionality of some of the most popular Office 365 Excel functions. In part 1 the focus was on the FILTER function. Building on this, we will explore how useful the SORT function is in arranging data more efficiently. What is the SORT […]

  • Be More Productive With Excel’s FILTER function (1 of 4)

    Wed 21 Jun 2023

    How often have you found when you filter Excel data, problems arise in getting it to work? This can happen when you are sharing workbooks or the source data changes frequently. The solution lies in Office 365’s FILTER function. This blog is part 1 of a series that explores the amazing functionality of some of […]

  • Power BI – Advanced options to make forecasting models

    Tue 4 Apr 2023

    Finally, there are new advanced options to create forecasting models in Power BI. Microsoft introduced the LINEST function and LINESTX function in the Power BI desktop February 2023 version. The LINEST function in Excel has always been an important tool for perform linear regression, leveraging the Least Squares method, to calculate a straight line that […]

  • How to ‘Freeze Panes’ in Excel

    Wed 22 Mar 2023

    How often when using Excel have you had to scroll down to find what you’re looking for in a huge spreadsheet only to find your top headings disappear off the screen? Well worry no more. The solution lies in using an incredibly handy tool called Freeze Panes. This tool ‘freezes’ the top row and left […]

  • Power BI – Quick Measures

    Thu 16 Mar 2023

    Microsoft has prepared Power BI to make it easier for users to perform DAX measures without a lot of DAX knowledge. To access the Quick Measures, click QUICK MEASURES on the Home tab. You will see a list of options to choose from. On the right side of the Quick Measure dialog box, you will […]

  • Tracking Performance using Conditional Formatting in Excel

    Thu 2 Mar 2023

    Conditional Formatting is one of the most powerful tools in Excel. It can do so much to help you track data with relatively little time and effort. This ‘Quick Win’ tool can be mastered in a few simple steps. The blog will look at what Conditional Formatting is, how to apply it to data and […]

  • Excel – The XLOOKUP function

    Mon 13 Feb 2023

    We can use LOOKUPSs in Excel to search for a value in a column or row, and return a value from a matching column or row. We look at them in a lot of depth on both our Excel Advanced and Excel Advanced Formulas and Functions courses. There are a number of lookup and reference functions […]

  • Let your Data tell the Story with Power BI

    Fri 25 Nov 2022

    Tired of interrupting your PowerPoint presentation just so that you can show the live version of your report in Power BI? You can now create interactive PowerPoint presentations which connect live to your Power BI reports! This blog will show how you can let your data tell the story with Power BI. Imagine that you […]

  • Solve date problems in Excel with Power Query

    Wed 28 Sep 2022

    Today I’m asking Jens, one of STL’s top Excel trainers, if there is a quick way to fix date issues in Excel. Can I solve date problems in Excel with Power Query? Hi Jens, do you have advice for me on how to handle date issues in Excel? Jens: I cannot count how many times […]

  • Maximise Data Performance with Data Modelling in Power BI

    Tue 27 Sep 2022

    Today, I’m talking with Martin, one of STL‘s outstanding Power BI trainers, about the importance of Data Modelling. I’m asking Martin how I can maximise my data’s performance with data modelling in Power BI. Hi Martin, thanks for taking the time to have a chat with me. My Power BI Reports often take ages to […]

  • Power BI AI Visuals Part 3 – Decomposition Tree

    Thu 22 Sep 2022

    Microsoft has created interesting and engaging AI (Artificial Intelligence) visuals for Power BI. The desktop app offers four AI visuals – Q&A, Key Influencers, Decomposition Tree, and Smart Narrative. This is Power BI AI Visuals Part 3 – Decomposition Tree, the third in a series which looks at all four AI visuals. AI visuals are […]

  • Power BI Artificial Intelligence Visuals Part 1 – Q&A

    Thu 15 Sep 2022

    Microsoft has created some very interesting AI (Artificial Intelligence) visuals for Power BI. Power BI offers four AI visuals – Q&A, Key Influencers, Decomposition Tree, and Smart Narrative. This article is Power BI Artificial Intelligence Visuals Part 1 – Q&A. It is the first in a series of 4 which will go through all four […]

  • Automate reports with Power Query M Coding

    Tue 13 Sep 2022

    This blog is for both Power BI and Excel users. In it, we demonstrate how you can automate reports with Power Query M coding What is Power Query? The Power Query tool in Excel and the Query Editor in Power BI are identical. They are important tools for both applications. In Excel, many tasks can […]

  • Comparing Power BI Desktop to the Power BI Service

    Tue 9 Aug 2022

    The different versions and configurations of Power BI can be confusing. In this blog, we are comparing Power BI Desktop to Power BI Service. This will shed light on how to use each of these apps. Power BI Desktop Power BI Desktop is a free application you can download and install on your local PC. […]

  • Create Field Parameters in Power BI

    Tue 26 Jul 2022

    Why is Power BI taking over the world? Why are so many organisations currently implementing Power BI? Power BI is the most efficient tool to manage business intelligence in a world where the data sets are getting bigger and bigger. The importance of making quick and correct decisions is a key factor in running a […]

  • How to Efficiently Cleanse and Reshape Data in Power BI

    Fri 22 Jul 2022

    You can improve efficiency and accuracy when pulling and transforming data from various sources by using the Query Editor Tool in Power BI. It’s a marked improvement on using macros in Excel for this function. Read on to see why. Why use the Query Editor The Query Editor is where data sourced from a variety […]

  • The Pros and Cons of Power Query

    Mon 11 Jul 2022

    In conversation with one of our Excel / Power BI trainers. In this post, we sit down with one of our training delivery team to look at the pros and cons of Power Query in Excel, as a new way of working with data. Jens, how would you describe Power Query in Excel in one […]

  • Increase Productivity with Power BI’s new Navigator Tools

    Mon 4 Jul 2022

    In this article we will introduce you to Power BI’s new Navigator tools used to enhance the functionality and appearance of your multi-page reports. If you use the app, this will help you increase productivity with Power BI’s new navigator tools. The scenario So, you’ve got your data all ready to be made into visuals […]

  • Excel or Power BI. Which is better for business reporting?

    Fri 11 Feb 2022

    (In conversation with Jens, one of our Excel/Power BI trainers) In this post we sit down with one of our training delivery team, Jens, to look at the pros and cons of Excel and Power BI when considering which reporting path is best for you and your organisation. Jens, you mentioned a frequently occurring question […]

  • The Magic of Power Query

    Mon 1 Nov 2021

    One word That describes Power Query in Excel – MAGIC!   Power Query will completely change the way you work in Excel! For most Excel users, Power Query could be the tool that reduces time spent in Excel dramatically. Power Query could also minimise the use of VBA coding in Excel. It can be seen as a […]

  • Power BI usage

    Everybody should be using Power BI – 10 Reasons Why

    Mon 26 Apr 2021

    What is Power BI? Perhaps you have heard it said that everybody should be using Power BI. But what is it, exactly? Power BI is a collection of software services, apps, and connectors. These work together to turn unrelated data sources into coherent, visually immersive, and interactive insights. The application consists of several elements that […]

  • 30 Reasons You Should Be Considering Power BI – Part 1

    Tue 8 Sep 2020

    A lot of people out there think that the story of Power BI is too good to be true. Here is a list of the reasons that we think you should consider Power BI as a self-service and/or Enterprise Business Intelligence Solution. It’s like the new Microsoft Microsoft have not been the best at listening […]

  • STL Skills Survey: UK Businesses Display IT Skills Gap

    Wed 26 Feb 2020

    Employees in the UK are struggling to deal with a major IT skills gap, with the average UK office worker spending more than half an hour a day struggling to figure out how to work their tech or IT systems. For most office workers in the United Kingdom, dealing with things like spreadsheets, presentations and […]

  • Maximising The Use Of Collected Business Data

    Fri 10 Jan 2020

    There’s a reason why firms spend millions investing in data sets or in curating their own data recovery and organisation methods. Maximising the use of collected business data is an important proofing system required at every stage of your decision-making process . Statistics and an informed look at results will always be your friends. If […]

  • 30 Reasons You Should Be Considering Power BI – Part 2

    Wed 8 Jan 2020

    A lot of people out there think that the story of Power BI is too good to be true. Here is a list of the reasons that wE think you should consider Power BI as a self-service and/or Enterprise Business Intelligence Solution.   Power BI has mobile apps Microsoft have released mobile applications that are […]

  • 5 reasons to switch reporting from Excel to Power BI

    Thu 20 Jun 2019

    For many years, Microsoft Excel has been the tried and tested reporting tool for many businesses. In 2019. more and more organisations are turning to Power BI as an alternative with its strong analytics and reporting functions.     With faster visualisations, statistical functions and calculations across broad datasets, it’s obvious that Power BI can […]

  • 8 Major Benefits of Microsoft Power BI You Must Know

    Having the right business intelligence at your fingertips is crucial in the drive to become agile and competitive. As businesses grow, it becomes increasingly difficult to manage data being generated regularly. With a siloing effect and biased reporting structures, it leads to the decision makers in business to make their judgement on data that may […]

  • Benefits of Using Power BI 

    Wed 30 Jan 2019

    Power BI is Microsoft’s powerful business intelligence tool. It’s a fantastic tool for visualising data, offering a range of benefits for analysts who want to be able to present their information in a more digestible way. Of course, there are other tools for visualisation, so why should you choose to use Microsoft Power BI instead […]

  • Forecasting in Excel 2016

    Fri 29 Jan 2016

    Forecasting is important in many circumstances to be able to do effective and efficient planning. The future electricity needs forecast vital to planning building more power stations; scheduling employees in a call centre next week requires forecasts of call volume; just imaging how much forecasting the planners behind London 2012 Olympic Games must have done. Forecasts can be needed months or years […]

  • Charts from a dropdown list

    Mon 14 Dec 2015

    Charts from a dropdown list in Excel Many people who use Excel can generate a chart or two on their spreadsheets. This is a relatively easy task to perform in Excel. These charts will either sit in data sheets or in their own sheets. Don’t you sometimes wish you had a button to click in Excel […]

  • What’s New in Excel 2016?

    Thu 9 Jul 2015

      Here’s what’s New in Excel 2016 With the launch of Office 2016 in the Autumn of 2015, you may be wondering about the new features in 2016 and what’s changed. With Excel at the core of many businesses, it would help to have all of the new features explained. We have compared the different versions of […]

  • How to Build an Automatic Gantt Chart in Excel

    Mon 22 Jun 2015

    An easy to update Gantt chart in Excel Building a Gantt chart in Excel is pretty easy. But what if you needed to update any of the tasks? This would usually mean lot’s of time consuming manual editing of cells.  But there is an easier way…. Step in Excel and the ever flexible conditional formatting function! Yes […]

  • Data Visualisation in Excel

    Data Visualisation in Excel

    Thu 21 May 2015

    By Ann K. Emery With an estimated user base of 500 million people worldwide, many of us use Excel at work and personally for home budgets, projects, to-do lists, and more. It doesn’t take too much use of Excel before you reach the point of trying to express your data visually. This is where Excel charting […]

  • Loop Through Excel Worksheets and Workbooks

    Tue 19 May 2015

    Using loops to easily make changes across multiple worksheets Loops are one of the key tools in Excel VBA when we need to perform tasks through a number of objects (cells, worksheets, charts, workbooks etc.) .  Here we will look at how to loop through Excel worksheets and workbooks. Loop Through Excel Worksheets Below you will […]

  • Create Dynamic Drop Down lists in Excel

    Thu 14 May 2015

    Quickly create drop down lists in Excel with automatic sorting The Drop Down list in Excel is a great automation tool. You can turn any data list into a drop down list which makes it easier to place items in cells. Drop down lists show the data in the same order in which they appear […]

  • Excel Dashboard

    Thu 23 Apr 2015

    Creating an Excel Dashboard – Election Special Video What is an Excel Dashboard? Dashboards are essentially reports in Excel that help you visualise and analyse complex pieces of data. In the following video we look at an example Excel dashboard to guide us through the mind boggling data being produced by the current UK general […]

  • voting ballot box

    What are the odds like for the UK General Election?

    Wed 22 Apr 2015

    The UK general election is almost upon us and it’s a tight race! It’s the most unpredictable election in memory and has already produced some lively debates and political speed-dating as potential alliances are considered. There are so many sources from which to gain the latest on likely election winners, and one such are the bookies. There are some […]

  • Linking web data to Excel

    Tue 21 Apr 2015

    Say goodbye to copy and pasting. Connecting Excel to website data There are times when having live data in Excel can be really useful. You may need the latest currency exchange rates, monitor your stocks, track house prices, the possibilities are endless. Once you have established the data links you can refresh the data, also […]


Posts pagination

← Newer Posts1 2 … 5 Older Posts →
216 posts in this category.

Excel category RSS


Training courses

Blog Categories

Consent preferences

TrustPilot Score

TrustScore 4.9   |   2367 reviews

TrustPilot Testimonials

Trustpilot

© 2025 STL – Blog

Powered by WordPress

To the top ↑ Up ↑