DAX (Data Analysis eXpressions) is the function language in Power BI desktop. When DAX is used to create measures, it can hard to understand the logic at times. Especially one piece, the Calculate function, can be challenging.

This is the fourth part of a series of blog posts, which will investigate the mysterious Calculate function.
The Calculate function react differently to row, column, filter, and table context than the other DAX functions and can be used with date intelligence and can handle many other special requirements.
Trick the data model to Pass Filters from Many to One Side of Relationship
In this blog post you will see how the Calculate function can trick the data model to Pass Filters from Many to One Side of Relationship.
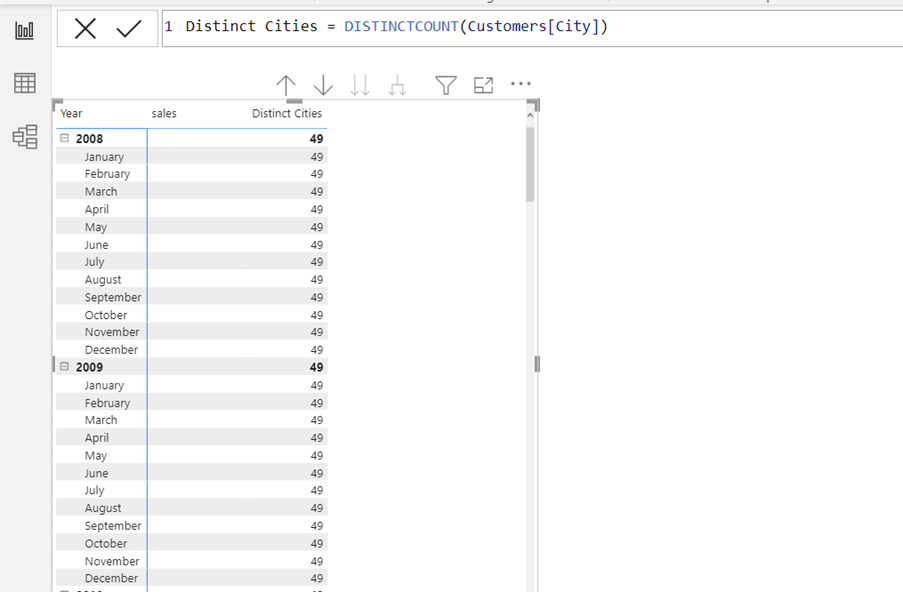
In a report the number of cities you have sold to need to be visualised.
A DistinctCount function can count distinct entries. However, as you can see below, the DistinctCount function cannot filter the result by month. It just returns 49, which are the total number of cities sold to.
The reason that the DistinctCount function cannot filter it by month is clear in the data model.
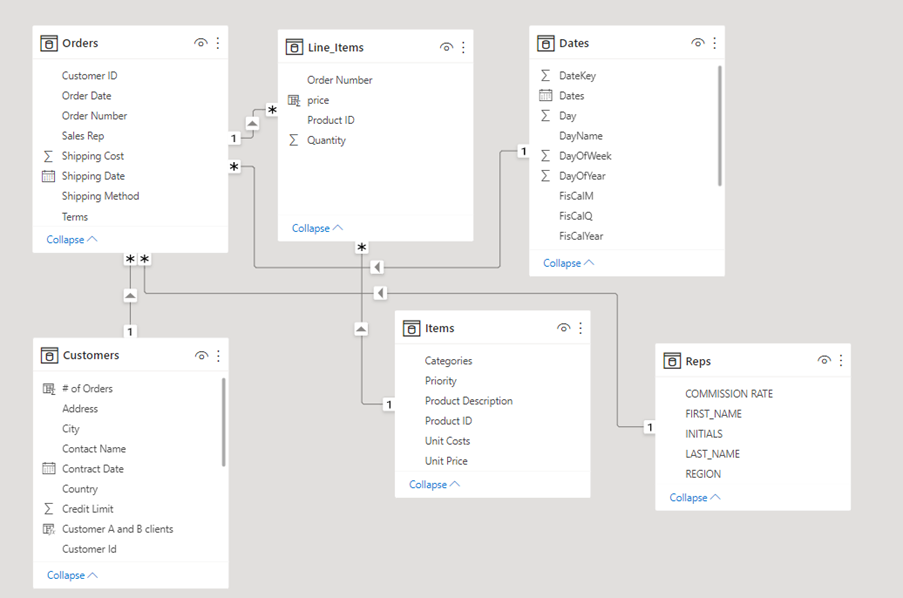
It goes against the filter direction in the relationship between the Orders and the Customers table.
The Dates table is related to the Orders table, and the filter direction is going from the Dates table to the Orders table, but the filter direction in the relationship between Orders to the Customers table is going from the Customer table to the Orders table. This means that the Dates table cannot filter the cities.
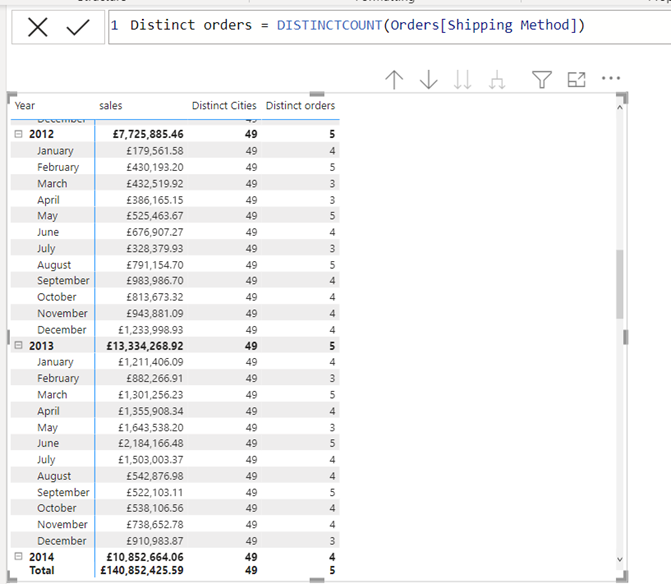
Distinct Shipping Methods
The DistinctCount function can show the number of distinct shipping methods used each month. This is because the relationship’s filter direction between the Dates and Orders table is going from the Dates table to the Orders table.
The task was to count how many different cities sold to each month. So how are you going to achieve this?
The mysterious Calculate function can handle this, as it can handle a lot of other special tasks.
The DAX measure will look like this:
Distinct Cities = CALCULATE(DISTINCTCOUNT(Customers[City]),orders)
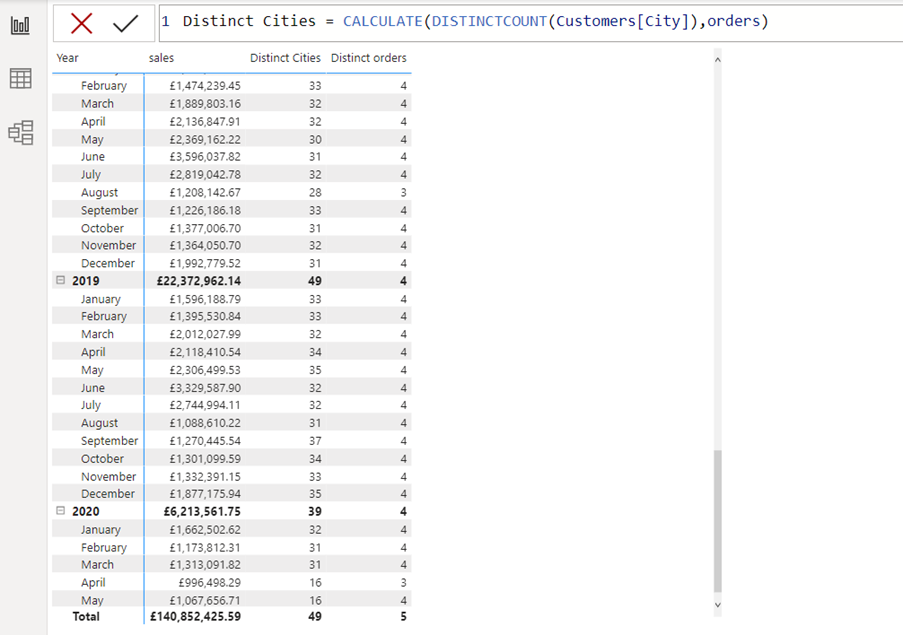
By nesting the DistinctCount function inside the Calculate function and adding the Orders table to a filter argument in the Calculate function, you now can pass filters from Many to One side of Relationship (go against the filter direction). You will need to enter the Calculate function into the expression to reference the table you want the expression from as well as in the filter argument the table, which are related to the table in the expression.
You can see above that now the measure returns the right result.
Distinct Products Sold
If you need to visualise the number of distinct products sold each month, you can use a similar approach.
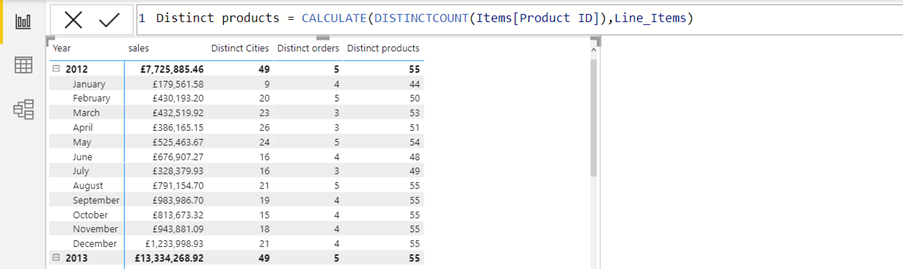
Again, you will have to go against the filter direction (Pass Filters from Many to One Side of Relationship). Here the relationship between the Items table and the Line Items table.

Conclusion
I call the Calculate function the mother of all DAX functions. It is the most important DAX function (my personal opinion). But you need to understand how it reacts to row, column, filter, and table context, and can be used to handle different issues. As a result, you will get the best out of it. Concluding in this blog which has shown how it can pass filters from Many to One Side of Relationship.
This is part 4 of a series of blog posts as mentioned at the top about the mysterious Calculate function in Power BI Dax.