Visualising data is crucial for decision making in any industry.
Power BI reports are a brilliantly efficient way to achieve this, as users have several useful visual options.
In this blog post you will learn how Power BI can display dynamic text for more detailed reports.

We will be using examples of sales data and HR data, but the logic, methods, and techniques can be used across all different industries, such as finance, healthcare, and retail and across all types of data sets.
DAX
To get the full benefit from this blog post, some experience and knowledge about DAX (Data Analysis eXpressions) is needed. We will use some DAX functions, but you could use a huge number of different DAX functions to create Dynamic text for more detailed reports.
Power BI Report Visuals
You have different options to provide your audience explanations or additional information to your Power BI report’s visuals. You can let Power BI desktop search for key influencers in your data model based on the visual by using the Artificial Intelligence Visual Smart Narrative.
You can write DAX measures and be in fully control of the text displayed in a text box (see the example below and the DAX used to achieve the example text).
Dyn text =
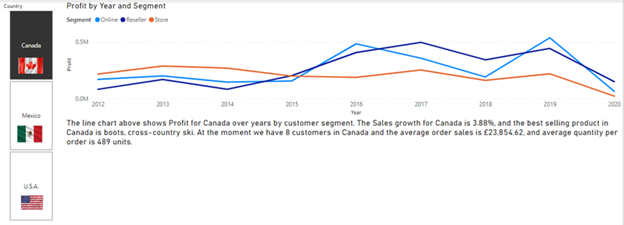
” The line chart above shows Profit for ” & VALUES ( Customers[Country] ) & ” over years by customer segment. The Sales growth for ”
& VALUES ( Customers[Country] ) & ” is ”
& FORMAT ( [Growth], “0.00” ) & “%, and the best selling product in ”
& VALUES ( Customers[Country] ) & ” is ”
& CONCATENATEX (
TOPN ( 1, values(Items[Product Description]), [Sales],DESC ),
[Product Description],
“;”
) & “. At the moment we have ”
& COUNT ( Customers[Customer Id] ) & ” customers in ”
& VALUES ( Customers[Country] ) & ” and the average order sales is ”
& FORMAT ( DIVIDE ( [Sales], COUNTROWS ( Orders ), 0 ), “currency”, “en-gb” ) & “, and average quantity per order is ”
& FORMAT (
DIVIDE ( SUM ( Line_Items[Quantity] ), COUNTROWS ( orders ), 0 ),
“0,00”
) & ” units.”
The DAX in this example will take to account any filtering on the report page and change the dynamic text based on the filters.
You can use a combination of the two options, and you can also use the AI tool Q&A to generate your dynamic text boxes. Furthermore, you can create Custom Tooltips with dynamic text which will popup when your audience hover over visuals.
In Power BI desktop all dynamic text will be underlined (a blue line) and cannot be changed, but when the report has been published and shared, the audience will not see the blue lines.
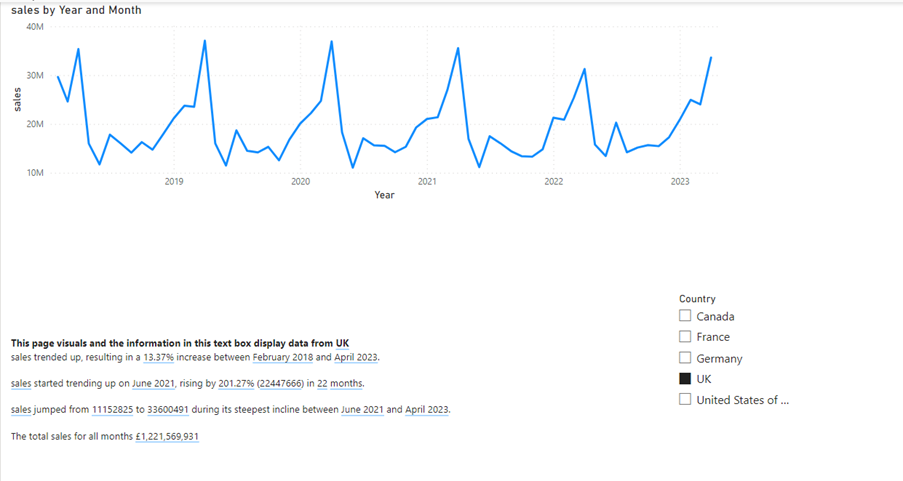
Example 1 – Combination of Smart Narrative and your own DAX measures and text.
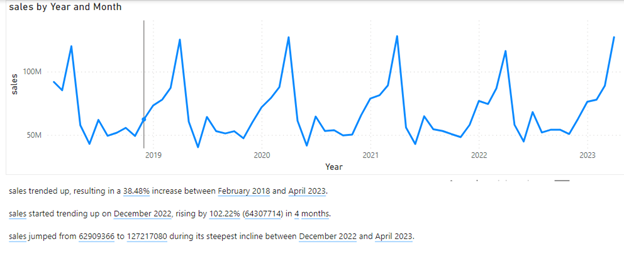
A line chart visual displaying sales over years and months has been selected and to get Power BI desktop to generate the text you will have to click “Narrative” on the Insert tab in the AI Visuals group.
You will get a text box where Power BI will write AI text based on the data set and selected visual.
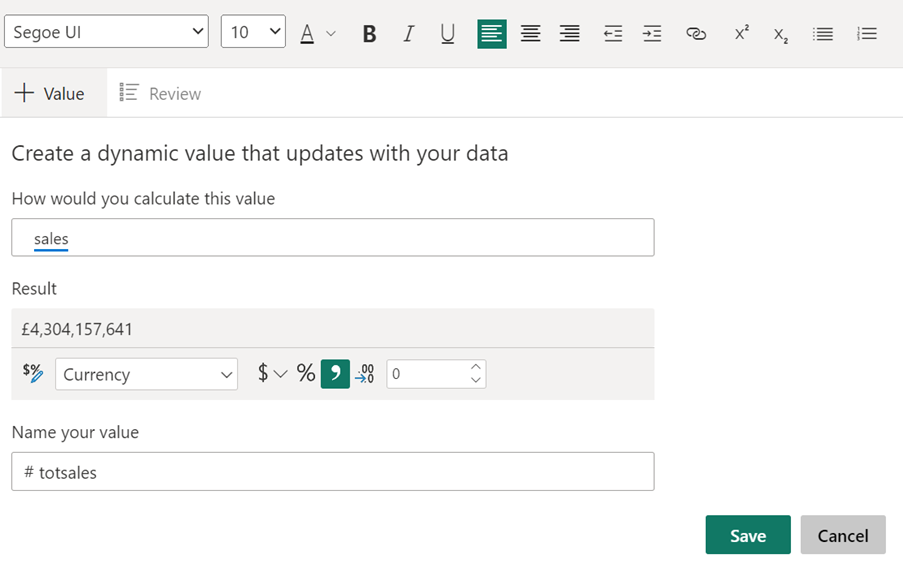
You cannot control the AI text the Narrative tool writes, but to add your own text, just click inside the text box and type. The text “The total sales for all months” is entered here. After the added text, the total sales amount is going to be displayed.
When you click inside the text box a tool bar will appear. Click +VALUE and you can type in the DAX measure you want to display the result from. Here I want to display the result from a DAX measure called sales. I have formatted the result as currency, and I named the result “totsales.” The name can be used to display the result somewhere else in the text box.
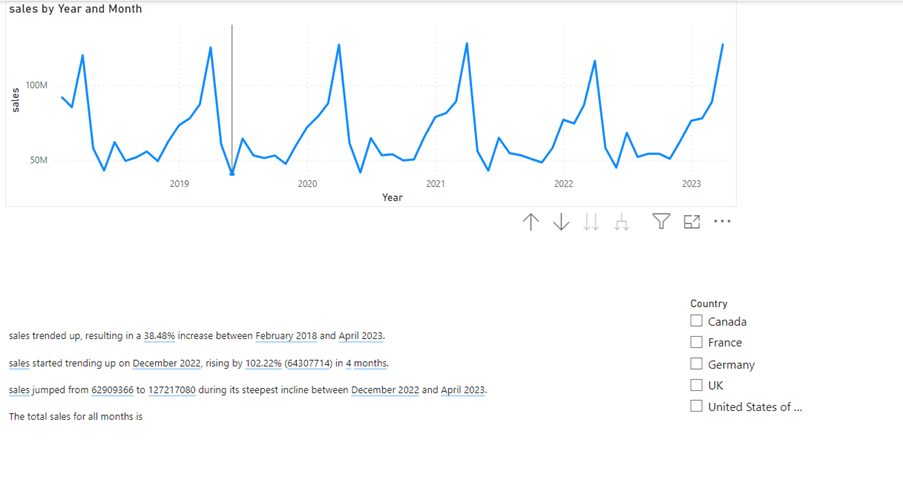
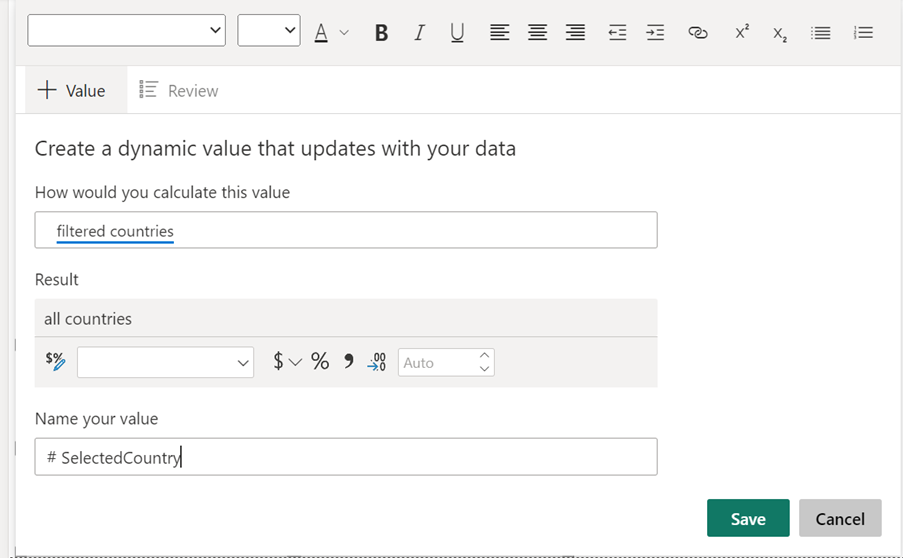
In the same text box, you may want to explain to the audience, how the visual and the information have been filtered. In this example a slicer has been added to page to filter the data by country.
The following DAX measure will pick up if the column with the heading Country in the table “tblsales” is filtered. If it is, it will return the country name selected from the slicer. Otherwise, it will return the text string ” all countries”.
Filtered countries = if(ISFILTERED(tblsales[Country]),SELECTEDVALUE(tblsales[Country]),”all countries”)
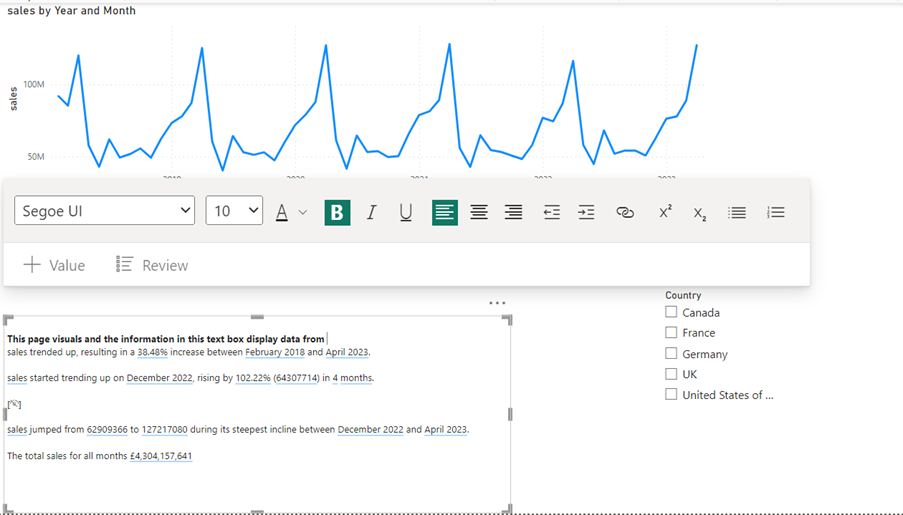
If you look at the screenshot above, you can see that the total sales amount is added to the text box and a new line at the top has been typed:
“This page visuals and the information in this text box display data from”
Place the mouse course where you want to add the dynamic text and click “+Value” and again the options will appear.
Now the text will show this if the page has not been filtered by country:
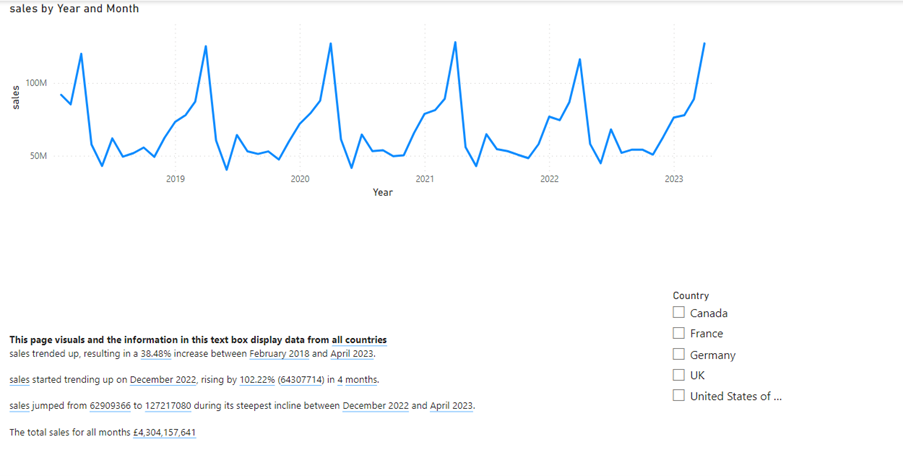
And this if the page has been filtered by “UK”:
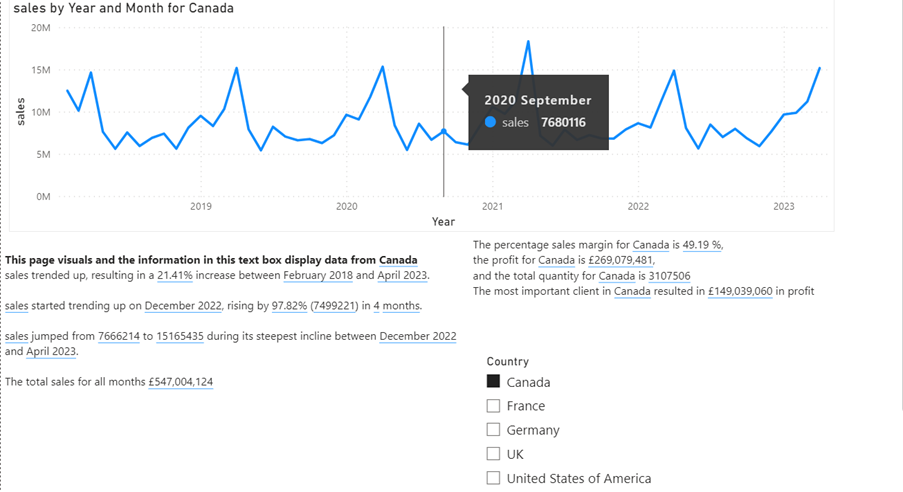
Example 2 – Combination of Q&A artificial intelligence and your own DAX measures and text.
If you do not want the smart narrative dynamic text, you can use the same method as in example 1 above. You will then just need to add a text box to the page.
In this example you will also see how the artificial intelligence tool Q&A can benefit you when you are creating dynamic text.
If we type “The percentage sales margin for” in a text box, then as in example 1 the DAX measure Filtered countries is used to return the country selected from the slicer. Then “is” is typed and then as in example 1, where a measure called Sales was added, another measure is added where the percentage sales margin was calculated. The same has been done to get the result from a profit measure.
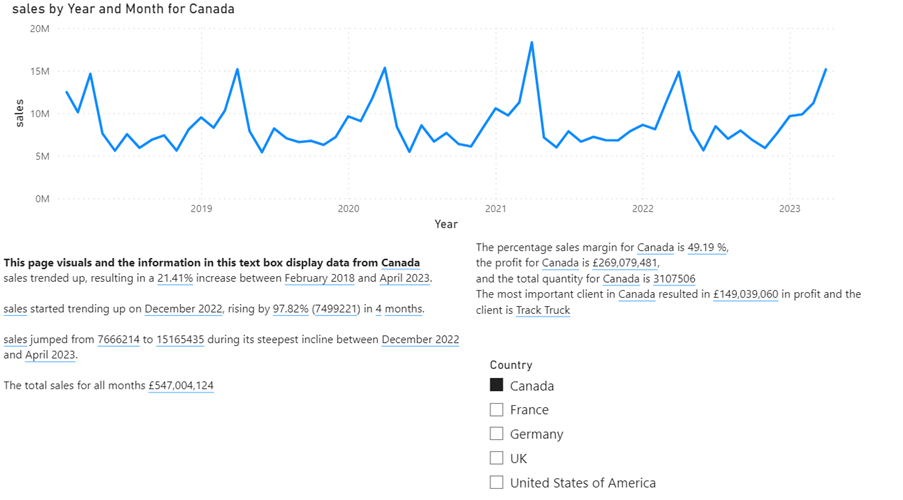
At this point, the text box displays:
The percentage sales margin for Canada is 49.19 %,
the profit for Canada is £269,079,481,
and the total quantity for Canada is
You will not even always have to do measures to return calculated results in dynamic text. Here the artificial intelligence tool Q&A can be particularly useful.
To get the total quantity in the text box click “+Value.”
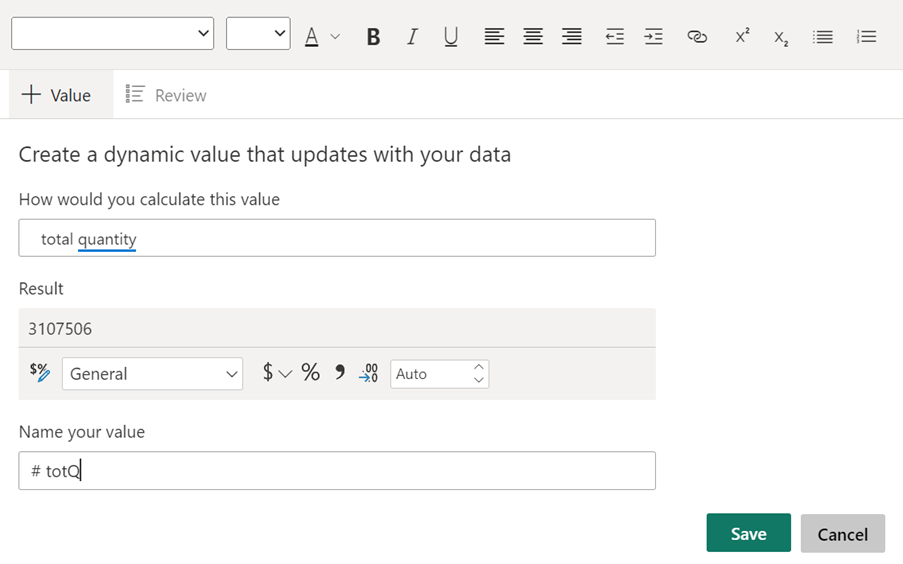
This will look in your data set and find a column with the name quantity and sum all the values in the column.
You will need to know your column headers.
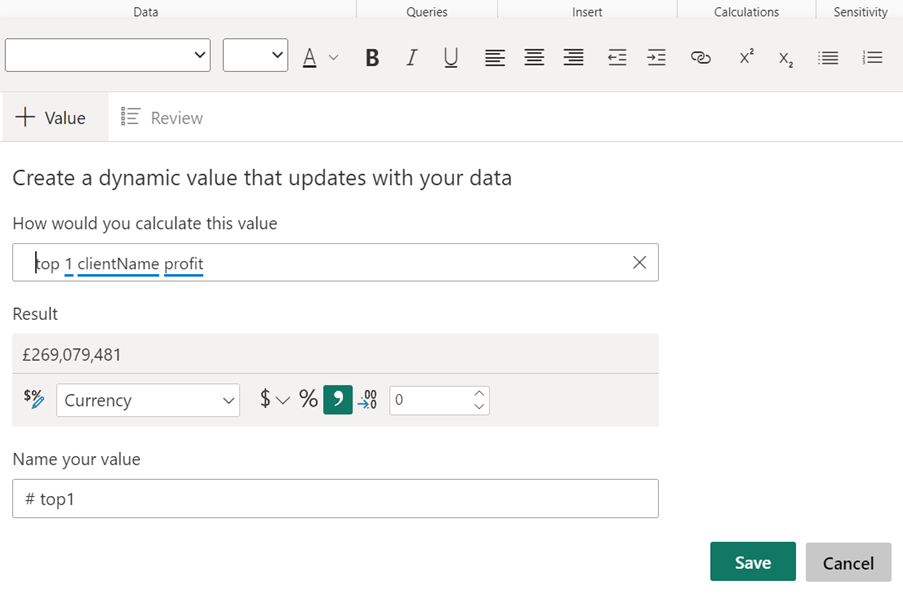
“top 1 ClientName profit” Q&A will look in the column ClientName and find top 1 client’s value based on a measure called profit.
And the result will look like this:
And this:
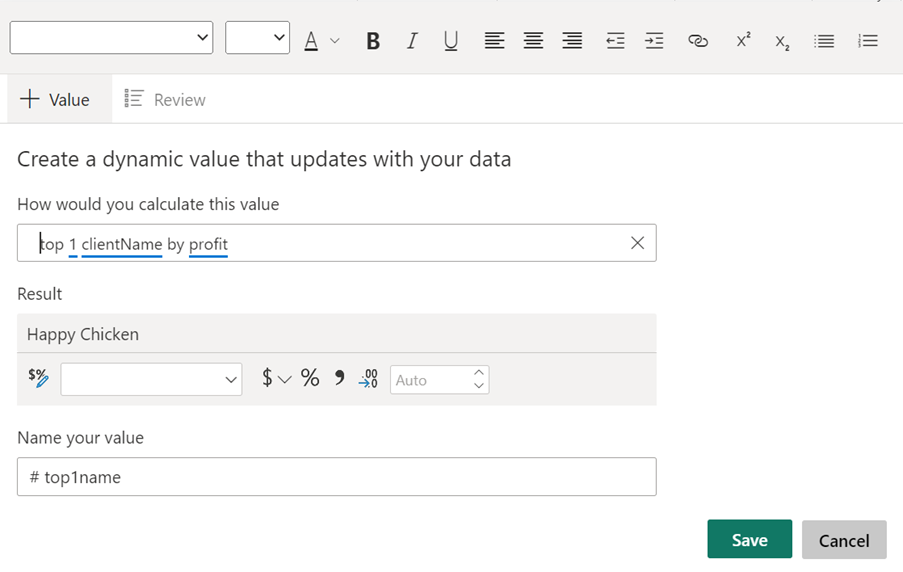
Will return the name of top 1 client based on profit.
Example 3 – Dynamic text in custom Tooltips for more detailed reports.
The methods are the same as above! The only difference is that the text box needs to be created on a tooltip page.
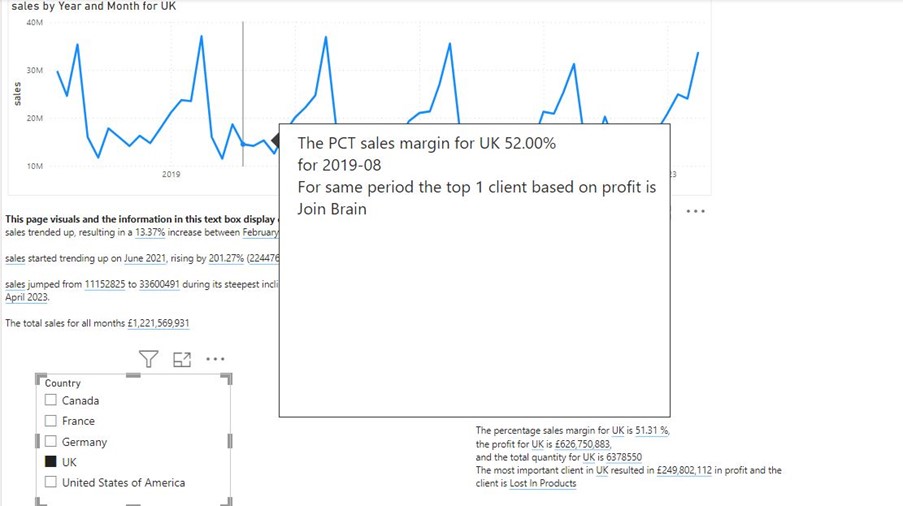
The dynamic text is also filtered by the data point you hover over on the visual. In the screen shot above, the mouse courser is on top of the data point for August 2019.
Conclusion
You can add much more information to your reports by creating dynamic text boxes. They enable you to explain the visuals, you can also point out specific details, which are important for the audience.
Filtering can be confusing in a Power BI report for the audience, but as you saw in this blog post, you can explain filters in dynamic text.
Further Reading:
https://www.stl-training.co.uk/b/power-bi-artificial-intelligence-visuals-part-1-qa/