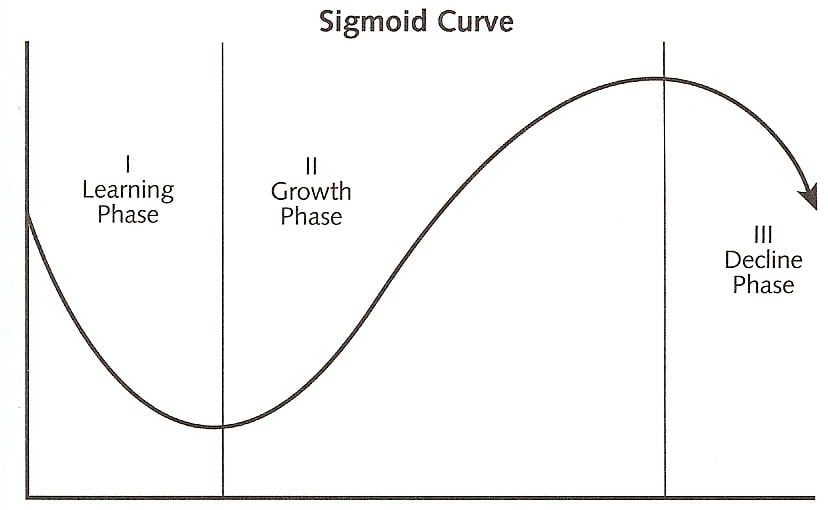
The Sigmoid Curve, or S Curve as it’s otherwise referred to, can represent any number of things. Its characteristics are easily recognisable with a period of slow initial growth, through rapid expansion and finally reaching a plateau. Its use varies from illustrating the lifecycle of a new product, the cost effectiveness of a training course, right through to our main area of discussion, evaluating the progression of a task for project management purposes.
DEFINITION
The S Curve represents the curvature in correlation between the actual time and cost components v the proposed time and cost allocations of specific resources.
THE S CURVE AND THE PRODUCT LIFECYCLE
Many of our clients will understand this analysis best as it directly relates with day to day operations.
Say for example, you’re launching a new product to market. Let’s assume too that all R&D has been completed and your shiny new product has hit the shelves. First, there will be a period of inception. Here few people know about your product and the cost of promotion will be negative to the revenue that you receive.
After a while, word of mouth and your advertising will begin to reap rewards, a sharp period of growth will ensue, until you reach a plateau and you find yourself in the maturity stage. Here you’ll still be selling lots of shiny products, but sooner or later, you’ll have to face the reality of decline in sales. Take a look at the graph below highlighting the process.
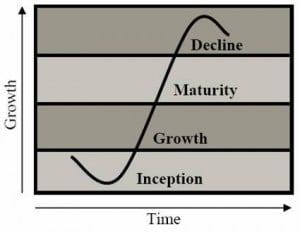
Please note that innovation at the maturity stage can result in an extension of the curve. A great example of this is the constant evolution of Facebook.
THE S CURVE & TRAINING YOUR WORKFORCE
Now let’s apply the principles learned previously into your companies training requirements.
You’ve recognised a gap in the skills knowledge of your staff and it’s time to increase their efficiency. Once trained and in the maturity stage, the monetary rewards of your highly efficient workforce will far outweigh the initial cost of having them trained in the first place (provided you choose the tight training provider)
Companies are understandably concerned about the initial outlay in funds when considering training their staff. Sure, if you’re going to train them properly, it’s going to cost more than if you’re just a local authority training for the sake of ticking a box.
THE S CURVE & PROJECT MANAGEMENT
We recently touched upon Earned Value Management (EVM). S Curve analysis and EVM work hand in hand with the former being a great way to measure growth, slippage and progress of a project. The S Curve may not be as calculated as Earned Value Equations, but it still provides a good indication as to how the project is going.
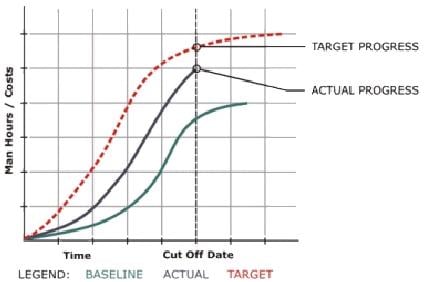
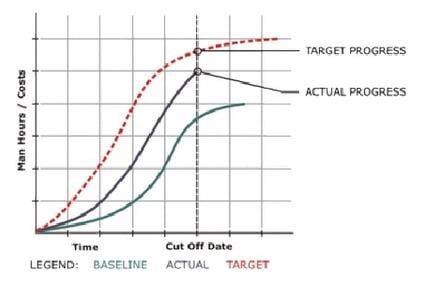
A typical S Curve diagram for Project Management plots Actual, Planned and Baseline Work Completed measures plotted against, labour or other costs.
MEASURING GROWTH
Similar to EVM you’re able to determine the growth of your project. Comparing the man hours / costs against the time taken to complete tasks along the way, you’re quickly able to see the growth of your project via the steepness of the curvature. If things are progressing too slowly, you might need to consider re-allocation of resources, however, if this is not an option you’ll likely need to apply for an extension to the completion date. Of course, the opposite can be applied to projects that are ahead of schedule.
The steepness of the curve indicates the measure of growth and is a great way to see plan whether the project is likely to catch up to Planned Work Completed targets.
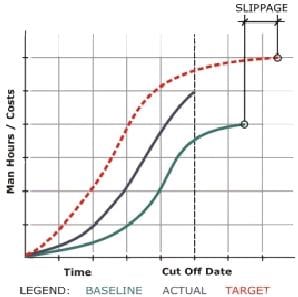
DETERMINING SLIPPAGE
Slippage is best defined as the amount of time that a project falls behind schedule and can be measured in hours, days, weeks, months or even years. Comparing the baseline S curve against the target S Curve will show these inadequacies. The further that the Target S Curve is to the right, the longer the period of delay will be.
Again, as with EVM, communication with your stakeholders is of utmost importance. Informing them of changes to schedule is as important in maintaining a strong relationship between them and yourself as project manager.
DETERMINE PROGRESS
Comparing the Actual S Curve against the Target S Curve will indicate your current progress. Although the Actual S Curve will usually sit below the Target S Curve for much of the project duration, it is hoped that both will converge at the finish. Please note that the Actual S Curve can never finish above the Target S Curve. You’ll need to conduct an audit into the credentials of your data if this occurs.
SO, WHY THE S SHAPE?
All projects go through a life cycle, from initiation, through to planning, execution and closure. As you’d image the first two phases have much less influence on the actual physical process of completing the task. Although without their input it would ironically be doomed to failure.